- Canada
- /
- Capital Markets
- /
- TSX:BAM
How Attractive Is Brookfield Asset Management After Its Recent Pullback and Growth in Infrastructure?

Reviewed by Bailey Pemberton
- If you are wondering whether Brookfield Asset Management is a bargain or just fairly priced at current levels, you are not alone. This stock often sits on watchlists of investors looking for quality compounders.
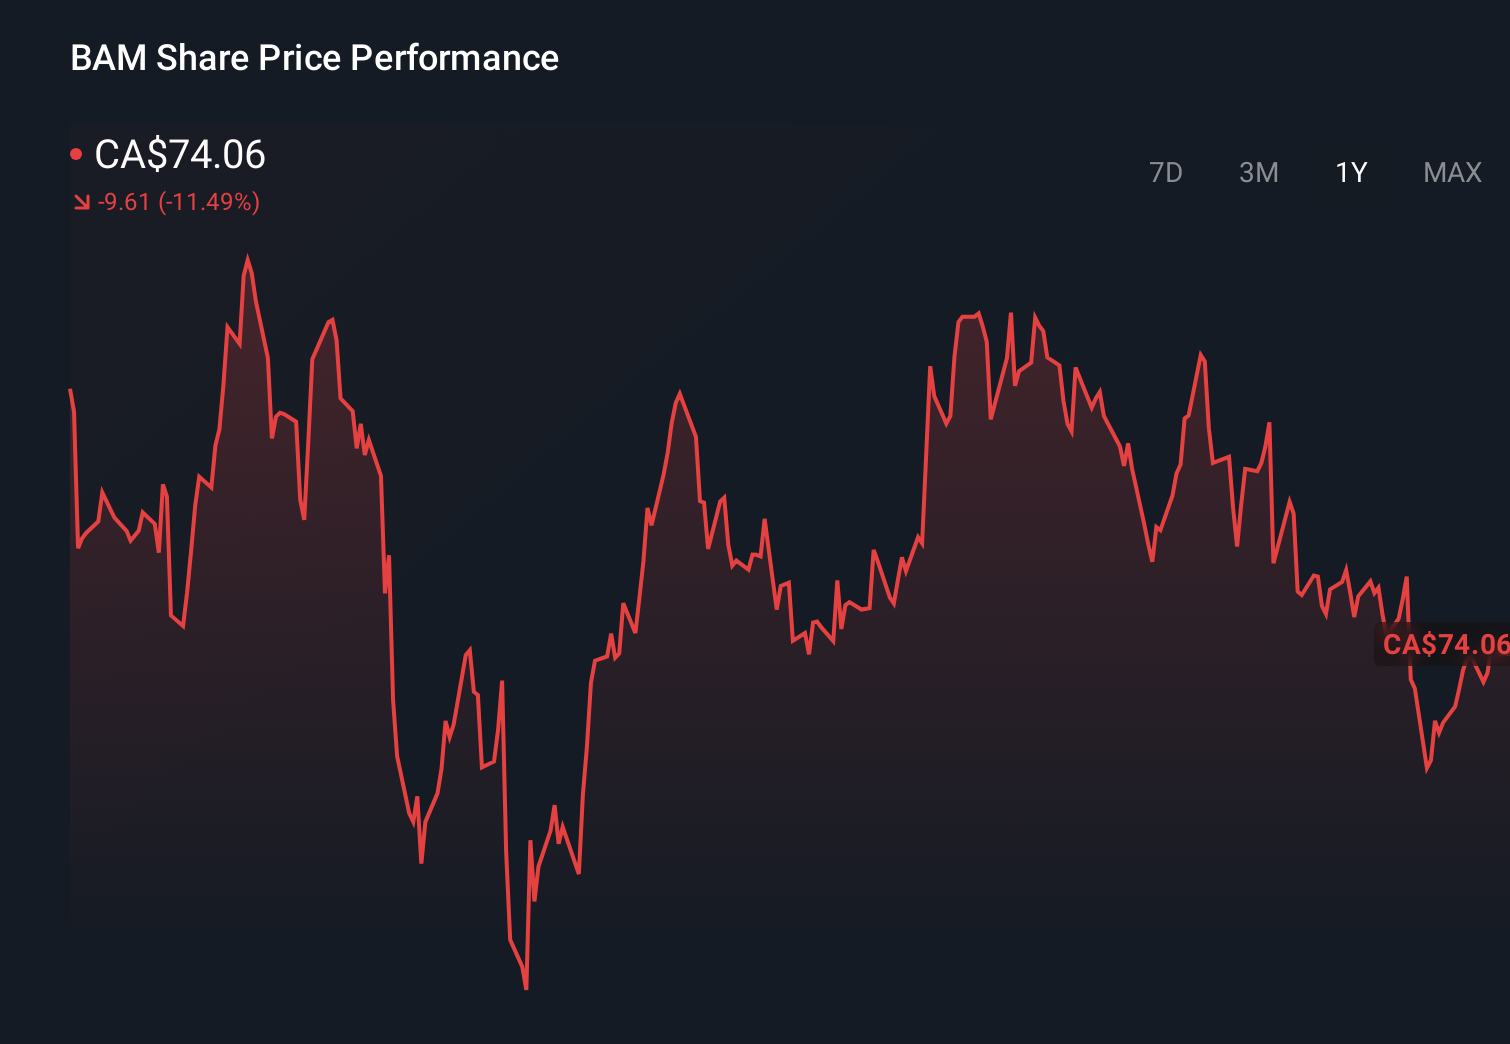
- Despite being down 2.8% over the last week and 8.1% year to date, shares are still up 109.7% over three years, which suggests the long term story has been much kinder than the recent tape.
- Recent headlines have focused on Brookfield’s continued push into infrastructure and renewable assets, as well as new capital commitments from large institutional partners, reinforcing its reputation as a go to alternative asset manager. At the same time, commentary around higher for longer interest rates has kept a spotlight on funding costs and deal activity, helping explain some of the recent share price volatility.
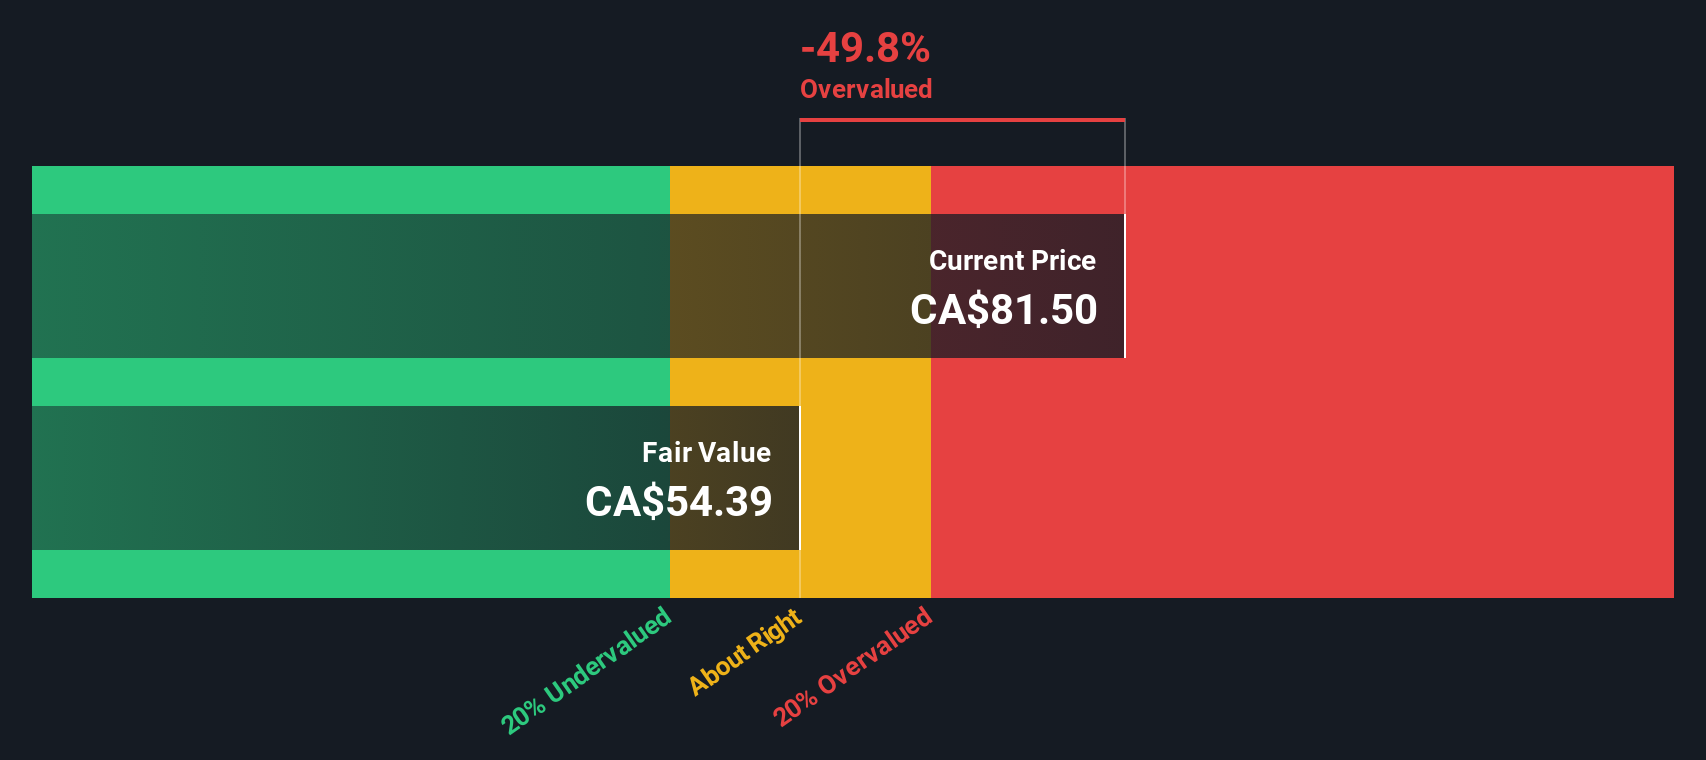
- On our framework, Brookfield Asset Management currently scores just 1/6 on our valuation checks. This means it only looks undervalued on one of six metrics, so the next step is to unpack what different valuation approaches say about the stock today and then look at a more complete way of thinking about value at the end of this article.
Brookfield Asset Management scores just 1/6 on our valuation checks. See what other red flags we found in the full valuation breakdown.
Approach 1: Brookfield Asset Management Excess Returns Analysis
The Excess Returns model looks at whether Brookfield Asset Management is creating value above the return that shareholders require, based on what it earns on its equity and how fast that equity base is growing.
Brookfield’s starting point is a Book Value of CA$5.25 per share and a Stable EPS estimate of CA$2.22 per share, drawn from forward looking Return on Equity assumptions from five analysts. With an Average Return on Equity of 36.69% and a Stable Book Value projected to reach CA$6.05 per share, the business is expected to continue generating strong profitability on the capital invested in it.
Against a Cost of Equity of CA$0.46 per share, Brookfield’s Excess Return is estimated at CA$1.76 per share. This means its profits comfortably exceed the required shareholder return. The model then capitalizes this into an intrinsic value estimate of about CA$58.27 per share. Relative to the current market price, this points to the shares trading roughly 23.6% above that estimate, so on this framework Brookfield looks overvalued rather than cheap.
Result: OVERVALUED
Our Excess Returns analysis suggests Brookfield Asset Management may be overvalued by 23.6%. Discover 912 undervalued stocks or create your own screener to find better value opportunities.
Approach 2: Brookfield Asset Management Price vs Earnings
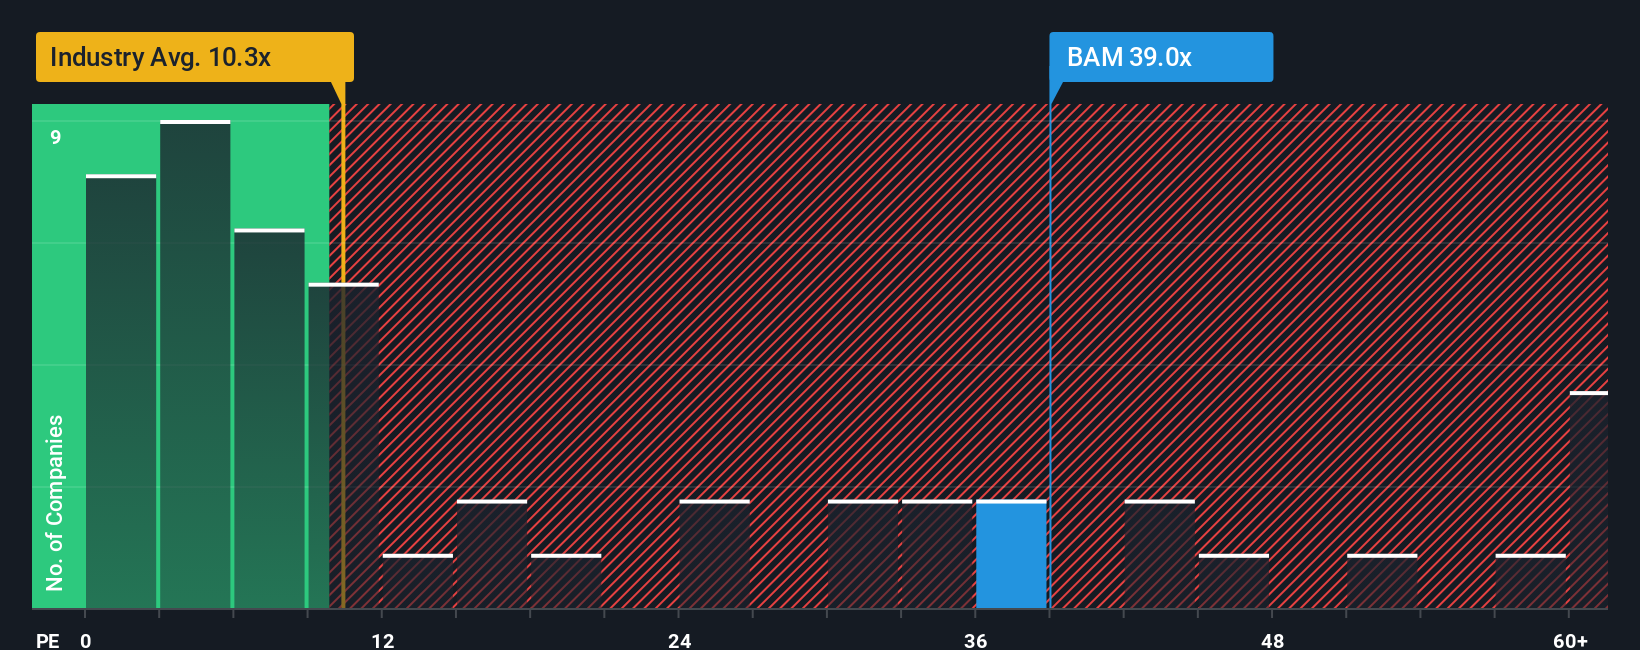
For a profitable company like Brookfield Asset Management, the price to earnings, or PE, ratio is a useful way to gauge how much investors are willing to pay today for each dollar of current earnings. Higher growth prospects and lower perceived risk usually justify a higher PE, while slower growth or more uncertainty should translate into a lower, more conservative multiple.
Brookfield currently trades on about 32.2x earnings, which is well above the broader Capital Markets industry average of around 8.6x but below the 49.7x average of its closest peers. To refine this comparison, Simply Wall St uses a proprietary “Fair Ratio” that estimates what a reasonable PE should be, given Brookfield’s earnings growth profile, margins, risk factors, industry positioning and market cap. This tailored metric, at about 23.9x for Brookfield, is more informative than simple peer or industry comparisons because it adjusts for the company’s specific fundamentals rather than assuming all Capital Markets businesses deserve the same multiple.
With the actual PE of 32.2x sitting notably above the Fair Ratio of 23.9x, Brookfield appears expensive on this preferred multiple framework.
Result: OVERVALUED
PE ratios tell one story, but what if the real opportunity lies elsewhere? Discover 1463 companies where insiders are betting big on explosive growth.
Upgrade Your Decision Making: Choose your Brookfield Asset Management Narrative
Earlier we mentioned that there is an even better way to understand valuation, so let us introduce you to Narratives, a simple way to connect your view of Brookfield Asset Management’s story with the numbers behind its future. A Narrative is your own investment storyline, where you spell out what you expect for revenue growth, earnings and margins, and the fair value you think those expectations justify. By linking the company’s story to a concrete financial forecast and then to a fair value estimate, Narratives turn vague hunches into a clear, testable thesis. They are easy to create and explore on Simply Wall St’s Community page, where millions of investors share their perspectives. Each Narrative automatically compares its Fair Value to today’s Price to help you decide whether Brookfield looks like a buy, a hold, or a sell. Because Narratives update dynamically as fresh news, earnings or guidance are released, your thesis stays alive and relevant instead of going stale. For example, one Brookfield Narrative might assume slower fundraising and a lower fair value, while another could expect faster growth in infrastructure fees and a higher fair value, leading to very different decisions.
Do you think there's more to the story for Brookfield Asset Management? Head over to our Community to see what others are saying!
This article by Simply Wall St is general in nature. We provide commentary based on historical data and analyst forecasts only using an unbiased methodology and our articles are not intended to be financial advice. It does not constitute a recommendation to buy or sell any stock, and does not take account of your objectives, or your financial situation. We aim to bring you long-term focused analysis driven by fundamental data. Note that our analysis may not factor in the latest price-sensitive company announcements or qualitative material. Simply Wall St has no position in any stocks mentioned.
The New Payments ETF Is Live on NASDAQ:
Money is moving to real-time rails, and a newly listed ETF now gives investors direct exposure. Fast settlement. Institutional custody. Simple access.
Explore how this launch could reshape portfolios
Sponsored ContentValuation is complex, but we're here to simplify it.
Discover if Brookfield Asset Management might be undervalued or overvalued with our detailed analysis, featuring fair value estimates, potential risks, dividends, insider trades, and its financial condition.
Access Free AnalysisHave feedback on this article? Concerned about the content? Get in touch with us directly. Alternatively, email editorial-team@simplywallst.com
About TSX:BAM
Brookfield Asset Management
A private equity firm specializing in acquisitions and growth capital investments.
Outstanding track record with excellent balance sheet.
Market Insights


Weekly Picks

Early mover in a fast growing industry. Likely to experience share price volatility as they scale


A case for CA$31.80 (undiluted), aka 8,616% upside from CA$0.37 (an 86 bagger!).


Moderation and Stabilisation: HOLD: Fair Price based on a 4-year Cycle is $12.08
Recently Updated Narratives

Airbnb Stock: Platform Growth in a World of Saturation and Scrutiny

Adobe Stock: AI-Fueled ARR Growth Pushes Guidance Higher, But Cost Pressures Loom

Thomson Reuters Stock: When Legal Intelligence Becomes Mission-Critical Infrastructure
Popular Narratives


Crazy Undervalued 42 Baggers Silver Play (Active & Running Mine)


NVDA: Expanding AI Demand Will Drive Major Data Center Investments Through 2026

The AI Infrastructure Giant Grows Into Its Valuation
Trending Discussion
