Advertisement
- Canada
- /
- Food and Staples Retail
- /
- TSX:WN
George Weston (TSX:WN) Valuation in Focus After Strong Sales and Profit Surge

Simply Wall St
Reviewed by Simply Wall St
George Weston (TSX:WN) grabbed attention after releasing its third quarter and nine-month results, showing a significant jump in both sales and net income compared to the previous year. These numbers have sparked renewed interest among investors.
See our latest analysis for George Weston.
Those robust earnings have clearly caught the market’s attention, as George Weston’s share price has climbed 24.1% so far this year and the 1-year total shareholder return stands at a healthy 24.6%. With a current price of $92.56, momentum has been building. This reflects renewed optimism after the strong results and an impressive 3-year total shareholder return of nearly 85%.
Curious what other companies are pushing higher this season? Now is the perfect moment to broaden your scope and discover fast growing stocks with high insider ownership
With shares near recent highs and robust results now public, the big question is whether George Weston remains undervalued or if the market has already priced in all the anticipated growth. This could make it tough to find further upside.
Price-to-Earnings of 34.7x: Is it justified?
George Weston’s current share price of CA$92.56 puts its price-to-earnings (P/E) ratio at 34.7x. This is meaningfully higher than both its peers and the wider industry, making shares look expensive on this metric.
The price-to-earnings ratio compares a company’s share price to its per-share earnings, providing a snapshot of how much investors are willing to pay for each dollar of profit. In the consumer retailing sector, this figure is closely watched as a barometer of expected profit growth and market confidence.
At 34.7x, George Weston’s P/E ratio stands above the peer average of 21.2x and the North American Consumer Retailing industry’s 20.1x. It is also significantly higher than the fair P/E ratio estimate of 23.8x, suggesting the market is currently pricing in elevated earnings growth or additional upside that diverges from historical and industry norms.
Explore the SWS fair ratio for George Weston
Result: Price-to-Earnings of 34.7x (OVERVALUED)
However, slower revenue growth or a shift in market sentiment could dampen further upside, especially if earnings momentum does not continue.
Find out about the key risks to this George Weston narrative.
Another View: Our DCF Model Points to Deep Value
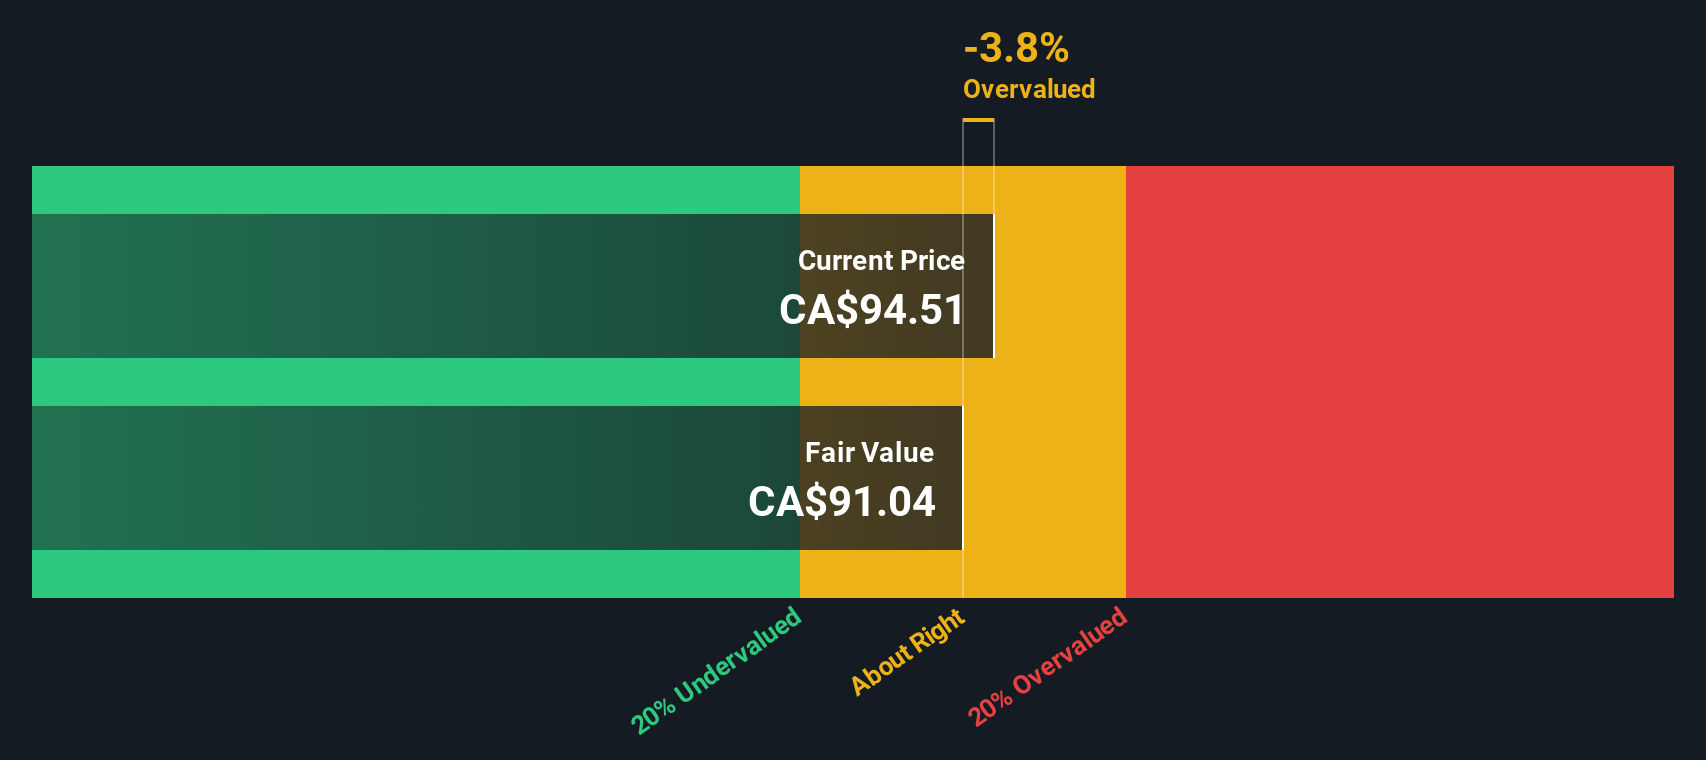
While the price-to-earnings ratio suggests George Weston is trading on the expensive side, our SWS DCF model tells a very different story. By examining the company’s future cash flows, the DCF indicates shares are actually trading at a significant discount to their fair value. This could be a hidden opportunity the market has overlooked.
Look into how the SWS DCF model arrives at its fair value.
Simply Wall St performs a discounted cash flow (DCF) on every stock in the world every day (check out George Weston for example). We show the entire calculation in full. You can track the result in your watchlist or portfolio and be alerted when this changes, or use our stock screener to discover 878 undervalued stocks based on their cash flows. If you save a screener we even alert you when new companies match - so you never miss a potential opportunity.
Build Your Own George Weston Narrative
If you see the numbers differently or want to dig deeper, why not craft your own assessment using our data tools in just minutes. Do it your way
A great starting point for your George Weston research is our analysis highlighting 2 key rewards and 1 important warning sign that could impact your investment decision.
Looking for More Smart Investment Ideas?
Unlock your next winning pick by tapping into exclusive lists curated for different strategies and sectors. Savvy investors stay one step ahead by acting early and not waiting for the crowd.
- Uncover high-growth potential when you scan these 3588 penny stocks with strong financials that pair solid fundamentals with real upside in overlooked sectors.
- Boost your future income stream by reviewing these 16 dividend stocks with yields > 3% offering reliable yields above 3%, ideal for compounding returns.
- Tap into the heartbeat of technological progress with these 24 AI penny stocks, featuring companies at the forefront of artificial intelligence innovation.
This article by Simply Wall St is general in nature. We provide commentary based on historical data and analyst forecasts only using an unbiased methodology and our articles are not intended to be financial advice. It does not constitute a recommendation to buy or sell any stock, and does not take account of your objectives, or your financial situation. We aim to bring you long-term focused analysis driven by fundamental data. Note that our analysis may not factor in the latest price-sensitive company announcements or qualitative material. Simply Wall St has no position in any stocks mentioned.
New: Manage All Your Stock Portfolios in One Place
We've created the ultimate portfolio companion for stock investors, and it's free.
• Connect an unlimited number of Portfolios and see your total in one currency
• Be alerted to new Warning Signs or Risks via email or mobile
• Track the Fair Value of your stocks
Have feedback on this article? Concerned about the content? Get in touch with us directly. Alternatively, email editorial-team@simplywallst.com
About TSX:WN
George Weston
Provides food and drug retailing, and financial services in Canada.
Average dividend payer with mediocre balance sheet.
Similar Companies
Market Insights

Advertisement
Community Narratives
MINISO's fair value is projected at 26.69 with an anticipated PE ratio shift of 20x
Fair Value US$24.03|11.0% undervalued
BE
Community Contributor
Procter & Gamble: A Dividend Giant Facing Slowing Growth
Fair Value US$119.81|23.3% overvalued
AN
Community Contributor
Eli Lilly's Future Growth Driven by Tirzepatide and Favorable Market Conditions
Fair Value US$1.19k|13.8% undervalued
EA
Community Contributor