
Advertisement
If we want to find a potential multi-bagger, often there are underlying trends that can provide clues. Ideally, a business will show two trends; firstly a growing return on capital employed (ROCE) and secondly, an increasing amount of capital employed. If you see this, it typically means it's a company with a great business model and plenty of profitable reinvestment opportunities. Although, when we looked at Empire (TSE:EMP.A), it didn't seem to tick all of these boxes.
What Is Return On Capital Employed (ROCE)?
For those who don't know, ROCE is a measure of a company's yearly pre-tax profit (its return), relative to the capital employed in the business. To calculate this metric for Empire, this is the formula:
Return on Capital Employed = Earnings Before Interest and Tax (EBIT) ÷ (Total Assets - Current Liabilities)
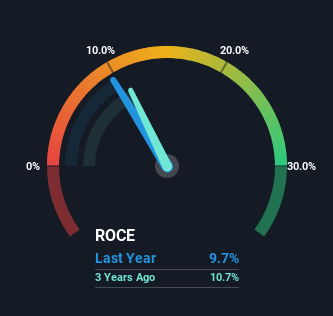
0.097 = CA$1.2b ÷ (CA$17b - CA$3.9b) (Based on the trailing twelve months to May 2024).
Thus, Empire has an ROCE of 9.7%. In absolute terms, that's a low return but it's around the Consumer Retailing industry average of 12%.
View our latest analysis for Empire
In the above chart we have measured Empire's prior ROCE against its prior performance, but the future is arguably more important. If you'd like to see what analysts are forecasting going forward, you should check out our free analyst report for Empire .
So How Is Empire's ROCE Trending?
In terms of Empire's historical ROCE trend, it doesn't exactly demand attention. The company has employed 86% more capital in the last five years, and the returns on that capital have remained stable at 9.7%. Given the company has increased the amount of capital employed, it appears the investments that have been made simply don't provide a high return on capital.
Our Take On Empire's ROCE
In summary, Empire has simply been reinvesting capital and generating the same low rate of return as before. And investors may be recognizing these trends since the stock has only returned a total of 12% to shareholders over the last five years. As a result, if you're hunting for a multi-bagger, we think you'd have more luck elsewhere.
Empire does have some risks though, and we've spotted 1 warning sign for Empire that you might be interested in.
If you want to search for solid companies with great earnings, check out this free list of companies with good balance sheets and impressive returns on equity.
Valuation is complex, but we're here to simplify it.
Discover if Empire might be undervalued or overvalued with our detailed analysis, featuring fair value estimates, potential risks, dividends, insider trades, and its financial condition.
Access Free AnalysisHave feedback on this article? Concerned about the content? Get in touch with us directly. Alternatively, email editorial-team (at) simplywallst.com.
This article by Simply Wall St is general in nature. We provide commentary based on historical data and analyst forecasts only using an unbiased methodology and our articles are not intended to be financial advice. It does not constitute a recommendation to buy or sell any stock, and does not take account of your objectives, or your financial situation. We aim to bring you long-term focused analysis driven by fundamental data. Note that our analysis may not factor in the latest price-sensitive company announcements or qualitative material. Simply Wall St has no position in any stocks mentioned.
Have feedback on this article? Concerned about the content? Get in touch with us directly. Alternatively, email editorial-team@simplywallst.com
About TSX:EMP.A
Empire
Engages in the food retail and related real estate businesses in Canada.
Solid track record with adequate balance sheet and pays a dividend.
Similar Companies
Market Insights

Advertisement
Community Narratives
MINISO's fair value is projected at 26.69 with an anticipated PE ratio shift of 20x
Fair Value US$24.03|11.0% undervalued
BE
Community Contributor
Procter & Gamble: A Dividend Giant Facing Slowing Growth
Fair Value US$119.81|23.3% overvalued
AN
Community Contributor
Eli Lilly's Future Growth Driven by Tirzepatide and Favorable Market Conditions
Fair Value US$1.19k|13.8% undervalued
EA
Community Contributor