
Advertisement
- Canada
- /
- Commercial Services
- /
- TSX:BYD
A Look At The Intrinsic Value Of Boyd Group Services Inc. (TSE:BYD)
Key Insights
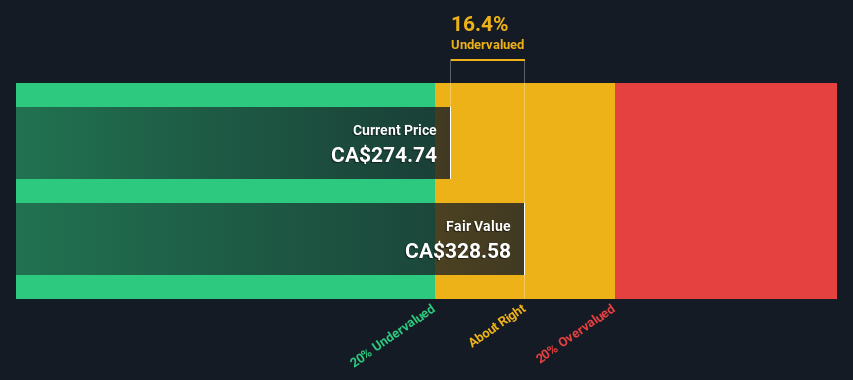
- Boyd Group Services' estimated fair value is CA$329 based on 2 Stage Free Cash Flow to Equity
- Current share price of CA$275 suggests Boyd Group Services is potentially trading close to its fair value
- Our fair value estimate is 1.7% higher than Boyd Group Services' analyst price target of US$323
Today we will run through one way of estimating the intrinsic value of Boyd Group Services Inc. (TSE:BYD) by taking the expected future cash flows and discounting them to today's value. We will take advantage of the Discounted Cash Flow (DCF) model for this purpose. It may sound complicated, but actually it is quite simple!
We would caution that there are many ways of valuing a company and, like the DCF, each technique has advantages and disadvantages in certain scenarios. If you want to learn more about discounted cash flow, the rationale behind this calculation can be read in detail in the Simply Wall St analysis model.
Check out our latest analysis for Boyd Group Services
The Method
We're using the 2-stage growth model, which simply means we take in account two stages of company's growth. In the initial period the company may have a higher growth rate and the second stage is usually assumed to have a stable growth rate. To start off with, we need to estimate the next ten years of cash flows. Where possible we use analyst estimates, but when these aren't available we extrapolate the previous free cash flow (FCF) from the last estimate or reported value. We assume companies with shrinking free cash flow will slow their rate of shrinkage, and that companies with growing free cash flow will see their growth rate slow, over this period. We do this to reflect that growth tends to slow more in the early years than it does in later years.
Generally we assume that a dollar today is more valuable than a dollar in the future, so we need to discount the sum of these future cash flows to arrive at a present value estimate:
10-year free cash flow (FCF) estimate
| 2024 | 2025 | 2026 | 2027 | 2028 | 2029 | 2030 | 2031 | 2032 | 2033 | |
| Levered FCF ($, Millions) | US$201.7m | US$252.0m | US$252.8m | US$254.8m | US$257.8m | US$261.4m | US$265.6m | US$270.1m | US$274.9m | US$280.0m |
| Growth Rate Estimate Source | Analyst x3 | Analyst x3 | Est @ 0.30% | Est @ 0.81% | Est @ 1.16% | Est @ 1.41% | Est @ 1.58% | Est @ 1.71% | Est @ 1.79% | Est @ 1.85% |
| Present Value ($, Millions) Discounted @ 6.6% | US$189 | US$222 | US$209 | US$198 | US$188 | US$178 | US$170 | US$162 | US$155 | US$148 |
("Est" = FCF growth rate estimated by Simply Wall St)
Present Value of 10-year Cash Flow (PVCF) = US$1.8b
The second stage is also known as Terminal Value, this is the business's cash flow after the first stage. The Gordon Growth formula is used to calculate Terminal Value at a future annual growth rate equal to the 5-year average of the 10-year government bond yield of 2.0%. We discount the terminal cash flows to today's value at a cost of equity of 6.6%.
Terminal Value (TV)= FCF2033 × (1 + g) ÷ (r – g) = US$280m× (1 + 2.0%) ÷ (6.6%– 2.0%) = US$6.2b
Present Value of Terminal Value (PVTV)= TV / (1 + r)10= US$6.2b÷ ( 1 + 6.6%)10= US$3.3b
The total value is the sum of cash flows for the next ten years plus the discounted terminal value, which results in the Total Equity Value, which in this case is US$5.1b. In the final step we divide the equity value by the number of shares outstanding. Relative to the current share price of CA$275, the company appears about fair value at a 16% discount to where the stock price trades currently. Remember though, that this is just an approximate valuation, and like any complex formula - garbage in, garbage out.
Important Assumptions
We would point out that the most important inputs to a discounted cash flow are the discount rate and of course the actual cash flows. If you don't agree with these result, have a go at the calculation yourself and play with the assumptions. The DCF also does not consider the possible cyclicality of an industry, or a company's future capital requirements, so it does not give a full picture of a company's potential performance. Given that we are looking at Boyd Group Services as potential shareholders, the cost of equity is used as the discount rate, rather than the cost of capital (or weighted average cost of capital, WACC) which accounts for debt. In this calculation we've used 6.6%, which is based on a levered beta of 0.995. Beta is a measure of a stock's volatility, compared to the market as a whole. We get our beta from the industry average beta of globally comparable companies, with an imposed limit between 0.8 and 2.0, which is a reasonable range for a stable business.
SWOT Analysis for Boyd Group Services
Strength
- Earnings growth over the past year exceeded the industry.
- Debt is well covered by earnings and cashflows.
Weakness
- Dividend is low compared to the top 25% of dividend payers in the Commercial Services market.
Opportunity
- Annual earnings are forecast to grow faster than the Canadian market.
- Current share price is below our estimate of fair value.
Threat
- Revenue is forecast to grow slower than 20% per year.
Moving On:
Whilst important, the DCF calculation is only one of many factors that you need to assess for a company. It's not possible to obtain a foolproof valuation with a DCF model. Preferably you'd apply different cases and assumptions and see how they would impact the company's valuation. If a company grows at a different rate, or if its cost of equity or risk free rate changes sharply, the output can look very different. For Boyd Group Services, we've put together three essential items you should look at:
- Risks: Take risks, for example - Boyd Group Services has 1 warning sign we think you should be aware of.
- Future Earnings: How does BYD's growth rate compare to its peers and the wider market? Dig deeper into the analyst consensus number for the upcoming years by interacting with our free analyst growth expectation chart.
- Other High Quality Alternatives: Do you like a good all-rounder? Explore our interactive list of high quality stocks to get an idea of what else is out there you may be missing!
PS. The Simply Wall St app conducts a discounted cash flow valuation for every stock on the TSX every day. If you want to find the calculation for other stocks just search here.
Valuation is complex, but we're here to simplify it.
Discover if Boyd Group Services might be undervalued or overvalued with our detailed analysis, featuring fair value estimates, potential risks, dividends, insider trades, and its financial condition.
Access Free AnalysisHave feedback on this article? Concerned about the content? Get in touch with us directly. Alternatively, email editorial-team (at) simplywallst.com.
This article by Simply Wall St is general in nature. We provide commentary based on historical data and analyst forecasts only using an unbiased methodology and our articles are not intended to be financial advice. It does not constitute a recommendation to buy or sell any stock, and does not take account of your objectives, or your financial situation. We aim to bring you long-term focused analysis driven by fundamental data. Note that our analysis may not factor in the latest price-sensitive company announcements or qualitative material. Simply Wall St has no position in any stocks mentioned.
About TSX:BYD
Boyd Group Services
Operates non-franchised collision repair centers in North America.
Undervalued with reasonable growth potential.
Market Insights

Advertisement
Community Narratives
MicroVision will explode future revenue by 380.37% with a vision towards success
Fair Value US$60.00|98.4% undervalued
TH
Community Contributor
The Indispensable Artery for a New North American Economy
Fair Value CA$132.87|1.3% undervalued
TI
Community Contributor