
Advertisement
Even when a business is losing money, it's possible for shareholders to make money if they buy a good business at the right price. For example, although software-as-a-service business Salesforce.com lost money for years while it grew recurring revenue, if you held shares since 2005, you'd have done very well indeed. Having said that, unprofitable companies are risky because they could potentially burn through all their cash and become distressed.
So, the natural question for Black Swan Graphene (CVE:SWAN) shareholders is whether they should be concerned by its rate of cash burn. In this report, we will consider the company's annual negative free cash flow, henceforth referring to it as the 'cash burn'. The first step is to compare its cash burn with its cash reserves, to give us its 'cash runway'.
Check out our latest analysis for Black Swan Graphene
How Long Is Black Swan Graphene's Cash Runway?
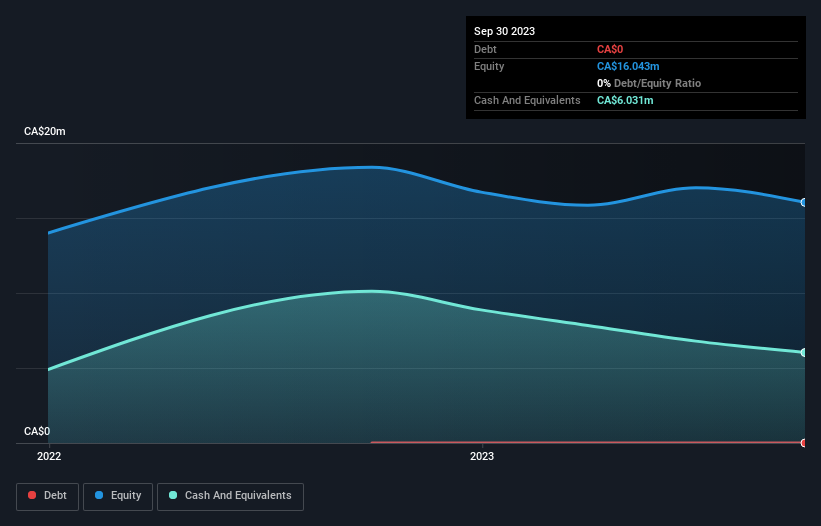
A company's cash runway is calculated by dividing its cash hoard by its cash burn. In September 2023, Black Swan Graphene had CA$6.0m in cash, and was debt-free. In the last year, its cash burn was CA$4.1m. Therefore, from September 2023 it had roughly 18 months of cash runway. While that cash runway isn't too concerning, sensible holders would be peering into the distance, and considering what happens if the company runs out of cash. You can see how its cash balance has changed over time in the image below.
How Is Black Swan Graphene's Cash Burn Changing Over Time?
Because Black Swan Graphene isn't currently generating revenue, we consider it an early-stage business. Nonetheless, we can still examine its cash burn trajectory as part of our assessment of its cash burn situation. During the last twelve months, its cash burn actually ramped up 81%. While this spending increase is no doubt intended to drive growth, if the trend continues the company's cash runway will shrink very quickly. While the past is always worth studying, it is the future that matters most of all. So you might want to take a peek at how much the company is expected to grow in the next few years.
Can Black Swan Graphene Raise More Cash Easily?
While Black Swan Graphene does have a solid cash runway, its cash burn trajectory may have some shareholders thinking ahead to when the company may need to raise more cash. Issuing new shares, or taking on debt, are the most common ways for a listed company to raise more money for its business. One of the main advantages held by publicly listed companies is that they can sell shares to investors to raise cash and fund growth. We can compare a company's cash burn to its market capitalisation to get a sense for how many new shares a company would have to issue to fund one year's operations.
Black Swan Graphene's cash burn of CA$4.1m is about 14% of its CA$29m market capitalisation. Given that situation, it's fair to say the company wouldn't have much trouble raising more cash for growth, but shareholders would be somewhat diluted.
Is Black Swan Graphene's Cash Burn A Worry?
Even though its increasing cash burn makes us a little nervous, we are compelled to mention that we thought Black Swan Graphene's cash burn relative to its market cap was relatively promising. We don't think its cash burn is particularly problematic, but after considering the range of factors in this article, we do think shareholders should be monitoring how it changes over time. Taking a deeper dive, we've spotted 4 warning signs for Black Swan Graphene you should be aware of, and 1 of them is a bit concerning.
If you would prefer to check out another company with better fundamentals, then do not miss this free list of interesting companies, that have HIGH return on equity and low debt or this list of stocks which are all forecast to grow.
Valuation is complex, but we're here to simplify it.
Discover if Black Swan Graphene might be undervalued or overvalued with our detailed analysis, featuring fair value estimates, potential risks, dividends, insider trades, and its financial condition.
Access Free AnalysisHave feedback on this article? Concerned about the content? Get in touch with us directly. Alternatively, email editorial-team (at) simplywallst.com.
This article by Simply Wall St is general in nature. We provide commentary based on historical data and analyst forecasts only using an unbiased methodology and our articles are not intended to be financial advice. It does not constitute a recommendation to buy or sell any stock, and does not take account of your objectives, or your financial situation. We aim to bring you long-term focused analysis driven by fundamental data. Note that our analysis may not factor in the latest price-sensitive company announcements or qualitative material. Simply Wall St has no position in any stocks mentioned.
About TSXV:SWAN
Black Swan Graphene
Engages in the production and commercialization of patented graphene products for industrial sectors in Canada.
Flawless balance sheet with slight risk.
Market Insights

Advertisement
Community Narratives
MINISO's fair value is projected at 26.69 with an anticipated PE ratio shift of 20x
Fair Value US$24.03|12.0% undervalued
BE
Community Contributor
Procter & Gamble: A Dividend Giant Facing Slowing Growth
Fair Value US$119.81|21.7% overvalued
AN
Community Contributor
Eli Lilly's Future Growth Driven by Tirzepatide and Favorable Market Conditions
Fair Value US$1.19k|14.1% undervalued
EA
Community Contributor