Stock Analysis
- Canada
- /
- Construction
- /
- TSX:WSP
Is WSP Global Inc.'s (TSE:WSP) Recent Stock Performance Influenced By Its Financials In Any Way?


Most readers would already know that WSP Global's (TSE:WSP) stock increased by 3.9% over the past month. Given that stock prices are usually aligned with a company's financial performance in the long-term, we decided to investigate if the company's decent financials had a hand to play in the recent price move. In this article, we decided to focus on WSP Global's ROE.
Return on Equity or ROE is a test of how effectively a company is growing its value and managing investors’ money. In short, ROE shows the profit each dollar generates with respect to its shareholder investments.
See our latest analysis for WSP Global
How Do You Calculate Return On Equity?
Return on equity can be calculated by using the formula:
Return on Equity = Net Profit (from continuing operations) ÷ Shareholders' Equity
So, based on the above formula, the ROE for WSP Global is:
8.8% = CA$566m ÷ CA$6.4b (Based on the trailing twelve months to March 2024).
The 'return' is the income the business earned over the last year. That means that for every CA$1 worth of shareholders' equity, the company generated CA$0.09 in profit.
What Has ROE Got To Do With Earnings Growth?
Thus far, we have learned that ROE measures how efficiently a company is generating its profits. Depending on how much of these profits the company reinvests or "retains", and how effectively it does so, we are then able to assess a company’s earnings growth potential. Generally speaking, other things being equal, firms with a high return on equity and profit retention, have a higher growth rate than firms that don’t share these attributes.
A Side By Side comparison of WSP Global's Earnings Growth And 8.8% ROE
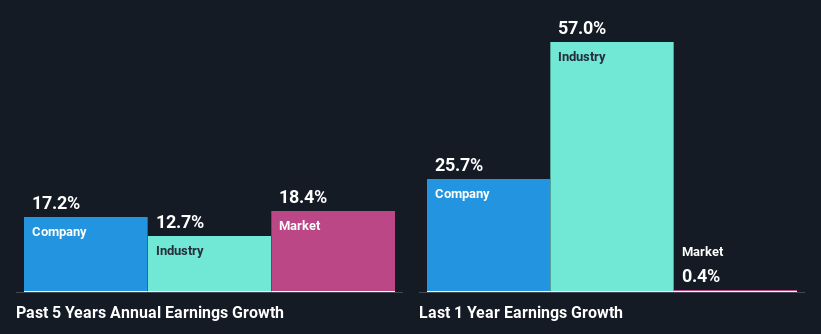
On the face of it, WSP Global's ROE is not much to talk about. Next, when compared to the average industry ROE of 16%, the company's ROE leaves us feeling even less enthusiastic. However, the moderate 17% net income growth seen by WSP Global over the past five years is definitely a positive. So, the growth in the company's earnings could probably have been caused by other variables. Such as - high earnings retention or an efficient management in place.
Next, on comparing with the industry net income growth, we found that WSP Global's growth is quite high when compared to the industry average growth of 13% in the same period, which is great to see.
Earnings growth is an important metric to consider when valuing a stock. What investors need to determine next is if the expected earnings growth, or the lack of it, is already built into the share price. This then helps them determine if the stock is placed for a bright or bleak future. What is WSP worth today? The intrinsic value infographic in our free research report helps visualize whether WSP is currently mispriced by the market.
Is WSP Global Using Its Retained Earnings Effectively?
With a three-year median payout ratio of 38% (implying that the company retains 62% of its profits), it seems that WSP Global is reinvesting efficiently in a way that it sees respectable amount growth in its earnings and pays a dividend that's well covered.
Moreover, WSP Global is determined to keep sharing its profits with shareholders which we infer from its long history of paying a dividend for at least ten years.
Conclusion
Overall, we feel that WSP Global certainly does have some positive factors to consider. Despite its low rate of return, the fact that the company reinvests a very high portion of its profits into its business, no doubt contributed to its high earnings growth. Having said that, looking at the current analyst estimates, we found that the company's earnings are expected to gain momentum. Are these analysts expectations based on the broad expectations for the industry, or on the company's fundamentals? Click here to be taken to our analyst's forecasts page for the company.
Valuation is complex, but we're helping make it simple.
Find out whether WSP Global is potentially over or undervalued by checking out our comprehensive analysis, which includes fair value estimates, risks and warnings, dividends, insider transactions and financial health.
View the Free AnalysisHave feedback on this article? Concerned about the content? Get in touch with us directly. Alternatively, email editorial-team (at) simplywallst.com.
This article by Simply Wall St is general in nature. We provide commentary based on historical data and analyst forecasts only using an unbiased methodology and our articles are not intended to be financial advice. It does not constitute a recommendation to buy or sell any stock, and does not take account of your objectives, or your financial situation. We aim to bring you long-term focused analysis driven by fundamental data. Note that our analysis may not factor in the latest price-sensitive company announcements or qualitative material. Simply Wall St has no position in any stocks mentioned.
Valuation is complex, but we're helping make it simple.
Find out whether WSP Global is potentially over or undervalued by checking out our comprehensive analysis, which includes fair value estimates, risks and warnings, dividends, insider transactions and financial health.
View the Free AnalysisHave feedback on this article? Concerned about the content? Get in touch with us directly. Alternatively, email editorial-team@simplywallst.com
About TSX:WSP
WSP Global
Operates as a professional services consulting firm in the United States, Canada, the United Kingdom, Sweden, Australia, and internationally.
Proven track record with adequate balance sheet.
