
Advertisement
- Canada
- /
- Trade Distributors
- /
- TSX:E
Is Enterprise Group, Inc.'s (TSE:E) Stock's Recent Performance Being Led By Its Attractive Financial Prospects?

Enterprise Group's (TSE:E) stock is up by a considerable 96% over the past three months. Since the market usually pay for a company’s long-term fundamentals, we decided to study the company’s key performance indicators to see if they could be influencing the market. Specifically, we decided to study Enterprise Group's ROE in this article.
ROE or return on equity is a useful tool to assess how effectively a company can generate returns on the investment it received from its shareholders. In other words, it is a profitability ratio which measures the rate of return on the capital provided by the company's shareholders.
Check out our latest analysis for Enterprise Group
How Do You Calculate Return On Equity?
Return on equity can be calculated by using the formula:
Return on Equity = Net Profit (from continuing operations) ÷ Shareholders' Equity
So, based on the above formula, the ROE for Enterprise Group is:
15% = CA$8.0m ÷ CA$52m (Based on the trailing twelve months to June 2024).
The 'return' refers to a company's earnings over the last year. That means that for every CA$1 worth of shareholders' equity, the company generated CA$0.15 in profit.
What Is The Relationship Between ROE And Earnings Growth?
Thus far, we have learned that ROE measures how efficiently a company is generating its profits. Based on how much of its profits the company chooses to reinvest or "retain", we are then able to evaluate a company's future ability to generate profits. Assuming all else is equal, companies that have both a higher return on equity and higher profit retention are usually the ones that have a higher growth rate when compared to companies that don't have the same features.
Enterprise Group's Earnings Growth And 15% ROE
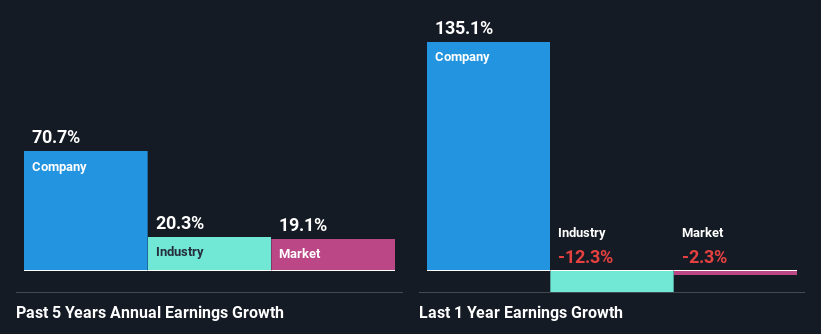
To start with, Enterprise Group's ROE looks acceptable. And on comparing with the industry, we found that the the average industry ROE is similar at 13%. This probably goes some way in explaining Enterprise Group's significant 71% net income growth over the past five years amongst other factors. However, there could also be other drivers behind this growth. For instance, the company has a low payout ratio or is being managed efficiently.
As a next step, we compared Enterprise Group's net income growth with the industry, and pleasingly, we found that the growth seen by the company is higher than the average industry growth of 20%.
Earnings growth is a huge factor in stock valuation. The investor should try to establish if the expected growth or decline in earnings, whichever the case may be, is priced in. By doing so, they will have an idea if the stock is headed into clear blue waters or if swampy waters await. Is Enterprise Group fairly valued compared to other companies? These 3 valuation measures might help you decide.
Is Enterprise Group Making Efficient Use Of Its Profits?
Enterprise Group doesn't pay any regular dividends to its shareholders, meaning that the company has been reinvesting all of its profits into the business. This is likely what's driving the high earnings growth number discussed above.
Conclusion
Overall, we are quite pleased with Enterprise Group's performance. Specifically, we like that the company is reinvesting a huge chunk of its profits at a high rate of return. This of course has caused the company to see substantial growth in its earnings. With that said, the latest industry analyst forecasts reveal that the company's earnings growth is expected to slow down. Are these analysts expectations based on the broad expectations for the industry, or on the company's fundamentals? Click here to be taken to our analyst's forecasts page for the company.
Valuation is complex, but we're here to simplify it.
Discover if Enterprise Group might be undervalued or overvalued with our detailed analysis, featuring fair value estimates, potential risks, dividends, insider trades, and its financial condition.
Access Free AnalysisHave feedback on this article? Concerned about the content? Get in touch with us directly. Alternatively, email editorial-team (at) simplywallst.com.
This article by Simply Wall St is general in nature. We provide commentary based on historical data and analyst forecasts only using an unbiased methodology and our articles are not intended to be financial advice. It does not constitute a recommendation to buy or sell any stock, and does not take account of your objectives, or your financial situation. We aim to bring you long-term focused analysis driven by fundamental data. Note that our analysis may not factor in the latest price-sensitive company announcements or qualitative material. Simply Wall St has no position in any stocks mentioned.
About TSX:E
Enterprise Group
Through its subsidiaries, operates as an equipment rental and construction services company in Canada.
High growth potential with excellent balance sheet.
Market Insights

Advertisement
Community Narratives
Vita Life Sciences Set for a 12.72% Revenue Growth While Tackling Operational Challenges
Fair Value AU$2.42|8.7% undervalued
RO
Community Contributor
Vossloh rides a €500 billion wave to boost growth and earnings in the next decade
Fair Value €78.41|6.3% undervalued
CH
Community Contributor
Intuitive Surgical Will Transform Healthcare with 12% Revenue Growth
Fair Value US$325.55|56.5% overvalued
UN
Community Contributor