
Advertisement
Can You Imagine How VersaBank's (TSE:VB) Shareholders Feel About The 52% Share Price Increase?
These days it's easy to simply buy an index fund, and your returns should (roughly) match the market. But one can do better than that by picking better than average stocks (as part of a diversified portfolio). To wit, the VersaBank (TSE:VB) share price is 52% higher than it was a year ago, much better than the market return of around 3.9% (not including dividends) in the same period. If it can keep that out-performance up over the long term, investors will do very well! Looking back further, the stock price is 45% higher than it was three years ago.
See our latest analysis for VersaBank
To paraphrase Benjamin Graham: Over the short term the market is a voting machine, but over the long term it's a weighing machine. One way to examine how market sentiment has changed over time is to look at the interaction between a company's share price and its earnings per share (EPS).
Over the last twelve months, VersaBank actually shrank its EPS by 4.2%.
We don't think that the decline in earnings per share is a good measure of the business over the last twelve months. It makes sense to check some of the other fundamental data for an explanation of the share price rise.
We doubt the modest 0.9% dividend yield is doing much to support the share price. Revenue was pretty stable on last year, so deeper research might be needed to explain the share price rise.
You can see below how earnings and revenue have changed over time (discover the exact values by clicking on the image).
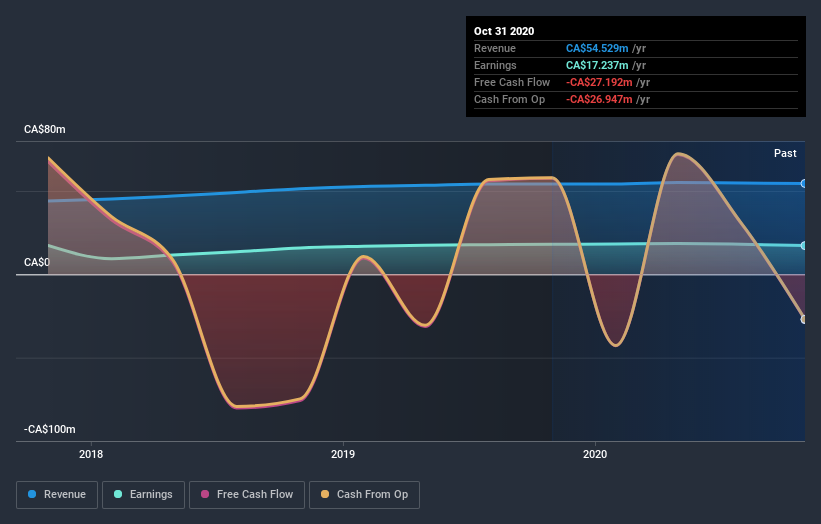
It's probably worth noting we've seen significant insider buying in the last quarter, which we consider a positive. On the other hand, we think the revenue and earnings trends are much more meaningful measures of the business. Dive deeper into the earnings by checking this interactive graph of VersaBank's earnings, revenue and cash flow.
What About Dividends?
When looking at investment returns, it is important to consider the difference between total shareholder return (TSR) and share price return. The TSR incorporates the value of any spin-offs or discounted capital raisings, along with any dividends, based on the assumption that the dividends are reinvested. So for companies that pay a generous dividend, the TSR is often a lot higher than the share price return. We note that for VersaBank the TSR over the last year was 54%, which is better than the share price return mentioned above. The dividends paid by the company have thusly boosted the total shareholder return.
A Different Perspective
We're pleased to report that VersaBank rewarded shareholders with a total shareholder return of 54% over the last year. And yes, that does include the dividend. That gain actually surpasses the 14% TSR it generated (per year) over three years. Given the track record of solid returns over varying time frames, it might be worth putting VersaBank on your watchlist. It's always interesting to track share price performance over the longer term. But to understand VersaBank better, we need to consider many other factors. Even so, be aware that VersaBank is showing 2 warning signs in our investment analysis , and 1 of those is a bit unpleasant...
There are plenty of other companies that have insiders buying up shares. You probably do not want to miss this free list of growing companies that insiders are buying.
Please note, the market returns quoted in this article reflect the market weighted average returns of stocks that currently trade on CA exchanges.
If you’re looking to trade VersaBank, open an account with the lowest-cost* platform trusted by professionals, Interactive Brokers. Their clients from over 200 countries and territories trade stocks, options, futures, forex, bonds and funds worldwide from a single integrated account. Promoted
New: Manage All Your Stock Portfolios in One Place
We've created the ultimate portfolio companion for stock investors, and it's free.
• Connect an unlimited number of Portfolios and see your total in one currency
• Be alerted to new Warning Signs or Risks via email or mobile
• Track the Fair Value of your stocks
This article by Simply Wall St is general in nature. It does not constitute a recommendation to buy or sell any stock, and does not take account of your objectives, or your financial situation. We aim to bring you long-term focused analysis driven by fundamental data. Note that our analysis may not factor in the latest price-sensitive company announcements or qualitative material. Simply Wall St has no position in any stocks mentioned.
*Interactive Brokers Rated Lowest Cost Broker by StockBrokers.com Annual Online Review 2020
Have feedback on this article? Concerned about the content? Get in touch with us directly. Alternatively, email editorial-team (at) simplywallst.com.
About TSX:VBNK
VersaBank
Provides various banking products and services in Canada and the United States.
High growth potential with excellent balance sheet.
Market Insights

Advertisement
Community Narratives
MicroVision will explode future revenue by 380.37% with a vision towards success
Fair Value US$60.00|98.4% undervalued
TH
Community Contributor
The Indispensable Artery for a New North American Economy
Fair Value CA$132.87|1.3% undervalued
TI
Community Contributor