
Advertisement
Bank of Nova Scotia (TSE:BNS) stock performs better than its underlying earnings growth over last three years
Low-cost index funds make it easy to achieve average market returns. But in any diversified portfolio of stocks, you'll see some that fall short of the average. That's what has happened with the The Bank of Nova Scotia (TSE:BNS) share price. It's up 24% over three years, but that is below the market return. In the last year the stock price gained, albeit only 4.9%.
The past week has proven to be lucrative for Bank of Nova Scotia investors, so let's see if fundamentals drove the company's three-year performance.
Check out our latest analysis for Bank of Nova Scotia
While the efficient markets hypothesis continues to be taught by some, it has been proven that markets are over-reactive dynamic systems, and investors are not always rational. By comparing earnings per share (EPS) and share price changes over time, we can get a feel for how investor attitudes to a company have morphed over time.
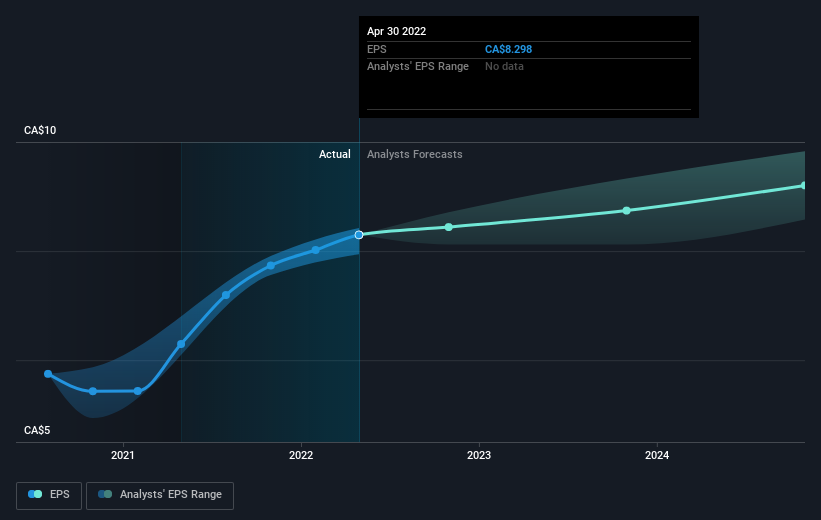
During three years of share price growth, Bank of Nova Scotia achieved compound earnings per share growth of 7.4% per year. Notably, the 8% average annual share price gain matches up nicely with the EPS growth rate. This observation indicates that the market's attitude to the business hasn't changed all that much. Au contraire, the share price change has arguably mimicked the EPS growth.
You can see how EPS has changed over time in the image below (click on the chart to see the exact values).
We consider it positive that insiders have made significant purchases in the last year. Even so, future earnings will be far more important to whether current shareholders make money. It might be well worthwhile taking a look at our free report on Bank of Nova Scotia's earnings, revenue and cash flow.
What About Dividends?
It is important to consider the total shareholder return, as well as the share price return, for any given stock. Whereas the share price return only reflects the change in the share price, the TSR includes the value of dividends (assuming they were reinvested) and the benefit of any discounted capital raising or spin-off. It's fair to say that the TSR gives a more complete picture for stocks that pay a dividend. We note that for Bank of Nova Scotia the TSR over the last 3 years was 45%, which is better than the share price return mentioned above. The dividends paid by the company have thusly boosted the total shareholder return.
A Different Perspective
It's nice to see that Bank of Nova Scotia shareholders have received a total shareholder return of 9.7% over the last year. And that does include the dividend. That's better than the annualised return of 7% over half a decade, implying that the company is doing better recently. Someone with an optimistic perspective could view the recent improvement in TSR as indicating that the business itself is getting better with time. It is all well and good that insiders have been buying shares, but we suggest you check here to see what price insiders were buying at.
If you like to buy stocks alongside management, then you might just love this free list of companies. (Hint: insiders have been buying them).
Please note, the market returns quoted in this article reflect the market weighted average returns of stocks that currently trade on CA exchanges.
Valuation is complex, but we're here to simplify it.
Discover if Bank of Nova Scotia might be undervalued or overvalued with our detailed analysis, featuring fair value estimates, potential risks, dividends, insider trades, and its financial condition.
Access Free AnalysisHave feedback on this article? Concerned about the content? Get in touch with us directly. Alternatively, email editorial-team (at) simplywallst.com.
This article by Simply Wall St is general in nature. We provide commentary based on historical data and analyst forecasts only using an unbiased methodology and our articles are not intended to be financial advice. It does not constitute a recommendation to buy or sell any stock, and does not take account of your objectives, or your financial situation. We aim to bring you long-term focused analysis driven by fundamental data. Note that our analysis may not factor in the latest price-sensitive company announcements or qualitative material. Simply Wall St has no position in any stocks mentioned.
About TSX:BNS
Bank of Nova Scotia
Provides various banking products and services in Canada, the United States, Mexico, Peru, Chile, Colombia, the Caribbean and Central America, and internationally.
Flawless balance sheet established dividend payer.
Similar Companies
Market Insights

Advertisement
Community Narratives
The company that turned a verb into a global necessity and basically runs the modern internet, digital ads, smartphones, maps, and AI.
Fair Value US$300.00|5.2% undervalued
OS
Community Contributor
Flowers Foods Pays A Fair Price For Health
Fair Value US$16.12|24.9% undervalued
NV
Community Contributor
TMX Group will thrive with 33.3% profit margin and enduring market moat
Fair Value CA$49.90|3.3% overvalued
LI
Community Contributor
The "Molecular Pencil": Why Beam's Technology is Built to Win
Fair Value US$65.01|64.5% undervalued
DA
Community Contributor