
Advertisement
- Brazil
- /
- Specialty Stores
- /
- BOVESPA:CEAB3
The Returns On Capital At C&A Modas (BVMF:CEAB3) Don't Inspire Confidence
If we want to find a stock that could multiply over the long term, what are the underlying trends we should look for? Amongst other things, we'll want to see two things; firstly, a growing return on capital employed (ROCE) and secondly, an expansion in the company's amount of capital employed. Ultimately, this demonstrates that it's a business that is reinvesting profits at increasing rates of return. Although, when we looked at C&A Modas (BVMF:CEAB3), it didn't seem to tick all of these boxes.
Understanding Return On Capital Employed (ROCE)
For those that aren't sure what ROCE is, it measures the amount of pre-tax profits a company can generate from the capital employed in its business. To calculate this metric for C&A Modas, this is the formula:
Return on Capital Employed = Earnings Before Interest and Tax (EBIT) ÷ (Total Assets - Current Liabilities)
0.02 = R$119m ÷ (R$9.0b - R$3.2b) (Based on the trailing twelve months to June 2022).
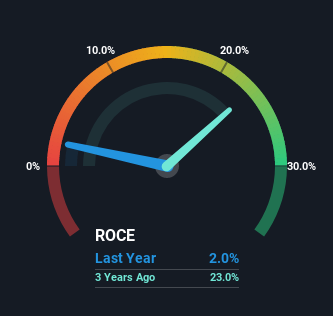
Thus, C&A Modas has an ROCE of 2.0%. Ultimately, that's a low return and it under-performs the Specialty Retail industry average of 9.7%.
View our latest analysis for C&A Modas
Above you can see how the current ROCE for C&A Modas compares to its prior returns on capital, but there's only so much you can tell from the past. If you'd like to see what analysts are forecasting going forward, you should check out our free report for C&A Modas.
What The Trend Of ROCE Can Tell Us
On the surface, the trend of ROCE at C&A Modas doesn't inspire confidence. Around five years ago the returns on capital were 8.9%, but since then they've fallen to 2.0%. However, given capital employed and revenue have both increased it appears that the business is currently pursuing growth, at the consequence of short term returns. And if the increased capital generates additional returns, the business, and thus shareholders, will benefit in the long run.
On a side note, C&A Modas has done well to pay down its current liabilities to 35% of total assets. That could partly explain why the ROCE has dropped. Effectively this means their suppliers or short-term creditors are funding less of the business, which reduces some elements of risk. Since the business is basically funding more of its operations with it's own money, you could argue this has made the business less efficient at generating ROCE.
The Key Takeaway
Even though returns on capital have fallen in the short term, we find it promising that revenue and capital employed have both increased for C&A Modas. And there could be an opportunity here if other metrics look good too, because the stock has declined 62% in the last year. So we think it'd be worthwhile to look further into this stock given the trends look encouraging.
If you'd like to know about the risks facing C&A Modas, we've discovered 2 warning signs that you should be aware of.
While C&A Modas may not currently earn the highest returns, we've compiled a list of companies that currently earn more than 25% return on equity. Check out this free list here.
New: AI Stock Screener & Alerts
Our new AI Stock Screener scans the market every day to uncover opportunities.
• Dividend Powerhouses (3%+ Yield)
• Undervalued Small Caps with Insider Buying
• High growth Tech and AI Companies
Or build your own from over 50 metrics.
Have feedback on this article? Concerned about the content? Get in touch with us directly. Alternatively, email editorial-team (at) simplywallst.com.
This article by Simply Wall St is general in nature. We provide commentary based on historical data and analyst forecasts only using an unbiased methodology and our articles are not intended to be financial advice. It does not constitute a recommendation to buy or sell any stock, and does not take account of your objectives, or your financial situation. We aim to bring you long-term focused analysis driven by fundamental data. Note that our analysis may not factor in the latest price-sensitive company announcements or qualitative material. Simply Wall St has no position in any stocks mentioned.
About BOVESPA:CEAB3
C&A Modas
Operates as a fashion retailer for women, men, and children in Brazil and internationally.
Flawless balance sheet with solid track record.
Market Insights

Advertisement
Community Narratives
MicroVision will explode future revenue by 380.37% with a vision towards success
Fair Value US$60.00|98.4% undervalued
TH
Community Contributor
The Indispensable Artery for a New North American Economy
Fair Value CA$132.87|1.3% undervalued
TI
Community Contributor