- Brazil
- /
- Consumer Durables
- /
- BOVESPA:GFSA3
Some Gafisa S.A. (BVMF:GFSA3) Shareholders Look For Exit As Shares Take 26% Pounding

To the annoyance of some shareholders, Gafisa S.A. (BVMF:GFSA3) shares are down a considerable 26% in the last month, which continues a horrid run for the company. For any long-term shareholders, the last month ends a year to forget by locking in a 51% share price decline.
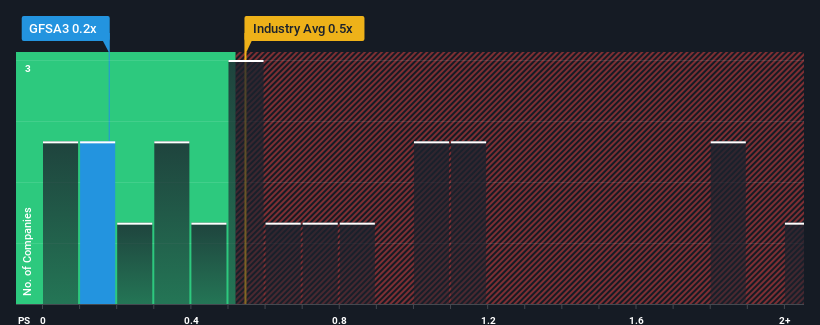
In spite of the heavy fall in price, you could still be forgiven for feeling indifferent about Gafisa's P/S ratio of 0.2x, since the median price-to-sales (or "P/S") ratio for the Consumer Durables industry in Brazil is also close to 0.5x. Although, it's not wise to simply ignore the P/S without explanation as investors may be disregarding a distinct opportunity or a costly mistake.
See our latest analysis for Gafisa
What Does Gafisa's P/S Mean For Shareholders?
For example, consider that Gafisa's financial performance has been poor lately as its revenue has been in decline. It might be that many expect the company to put the disappointing revenue performance behind them over the coming period, which has kept the P/S from falling. If not, then existing shareholders may be a little nervous about the viability of the share price.
Although there are no analyst estimates available for Gafisa, take a look at this free data-rich visualisation to see how the company stacks up on earnings, revenue and cash flow.What Are Revenue Growth Metrics Telling Us About The P/S?
Gafisa's P/S ratio would be typical for a company that's only expected to deliver moderate growth, and importantly, perform in line with the industry.
Retrospectively, the last year delivered a frustrating 24% decrease to the company's top line. The last three years don't look nice either as the company has shrunk revenue by 17% in aggregate. Accordingly, shareholders would have felt downbeat about the medium-term rates of revenue growth.
Comparing that to the industry, which is predicted to deliver 19% growth in the next 12 months, the company's downward momentum based on recent medium-term revenue results is a sobering picture.
With this in mind, we find it worrying that Gafisa's P/S exceeds that of its industry peers. Apparently many investors in the company are way less bearish than recent times would indicate and aren't willing to let go of their stock right now. There's a good chance existing shareholders are setting themselves up for future disappointment if the P/S falls to levels more in line with the recent negative growth rates.
What We Can Learn From Gafisa's P/S?
Gafisa's plummeting stock price has brought its P/S back to a similar region as the rest of the industry. It's argued the price-to-sales ratio is an inferior measure of value within certain industries, but it can be a powerful business sentiment indicator.
We find it unexpected that Gafisa trades at a P/S ratio that is comparable to the rest of the industry, despite experiencing declining revenues during the medium-term, while the industry as a whole is expected to grow. When we see revenue heading backwards in the context of growing industry forecasts, it'd make sense to expect a possible share price decline on the horizon, sending the moderate P/S lower. Unless the recent medium-term conditions improve markedly, investors will have a hard time accepting the share price as fair value.
We don't want to rain on the parade too much, but we did also find 3 warning signs for Gafisa that you need to be mindful of.
If you're unsure about the strength of Gafisa's business, why not explore our interactive list of stocks with solid business fundamentals for some other companies you may have missed.
Mobile Infrastructure for Defense and Disaster
The next wave in robotics isn't humanoid. Its fully autonomous towers delivering 5G, ISR, and radar in under 30 minutes, anywhere.
Get the investor briefing before the next round of contracts
Sponsored On Behalf of CiTechNew: Manage All Your Stock Portfolios in One Place
We've created the ultimate portfolio companion for stock investors, and it's free.
• Connect an unlimited number of Portfolios and see your total in one currency
• Be alerted to new Warning Signs or Risks via email or mobile
• Track the Fair Value of your stocks
Have feedback on this article? Concerned about the content? Get in touch with us directly. Alternatively, email editorial-team (at) simplywallst.com.
This article by Simply Wall St is general in nature. We provide commentary based on historical data and analyst forecasts only using an unbiased methodology and our articles are not intended to be financial advice. It does not constitute a recommendation to buy or sell any stock, and does not take account of your objectives, or your financial situation. We aim to bring you long-term focused analysis driven by fundamental data. Note that our analysis may not factor in the latest price-sensitive company announcements or qualitative material. Simply Wall St has no position in any stocks mentioned.
About BOVESPA:GFSA3
Gafisa
Operates as a development and construction company under the Gafisa brand name in Brazil.
Moderate risk and slightly overvalued.
Market Insights

Weekly Picks

Early mover in a fast growing industry. Likely to experience share price volatility as they scale


A case for CA$31.80 (undiluted), aka 8,616% upside from CA$0.37 (an 86 bagger!).


Moderation and Stabilisation: HOLD: Fair Price based on a 4-year Cycle is $12.08
Recently Updated Narratives

Airbnb Stock: Platform Growth in a World of Saturation and Scrutiny

Clarivate Stock: When Data Becomes the Backbone of Innovation and Law

Adobe Stock: AI-Fueled ARR Growth Pushes Guidance Higher, But Cost Pressures Loom
Popular Narratives


Crazy Undervalued 42 Baggers Silver Play (Active & Running Mine)


NVDA: Expanding AI Demand Will Drive Major Data Center Investments Through 2026


MicroVision will explode future revenue by 380.37% with a vision towards success
Trending Discussion
