Tupy's (BVMF:TUPY3) earnings growth rate lags the 8.3% CAGR delivered to shareholders


When we invest, we're generally looking for stocks that outperform the market average. And while active stock picking involves risks (and requires diversification) it can also provide excess returns. To wit, the Tupy share price has climbed 30% in five years, easily topping the market return of 17% (ignoring dividends). On the other hand, the more recent gains haven't been so impressive, with shareholders gaining just 5.6% , including dividends .
In light of the stock dropping 7.4% in the past week, we want to investigate the longer term story, and see if fundamentals have been the driver of the company's positive five-year return.
View our latest analysis for Tupy
While the efficient markets hypothesis continues to be taught by some, it has been proven that markets are over-reactive dynamic systems, and investors are not always rational. One imperfect but simple way to consider how the market perception of a company has shifted is to compare the change in the earnings per share (EPS) with the share price movement.
During the five years of share price growth, Tupy moved from a loss to profitability. That's generally thought to be a genuine positive, so we would expect to see an increasing share price.
The company's earnings per share (over time) is depicted in the image below (click to see the exact numbers).
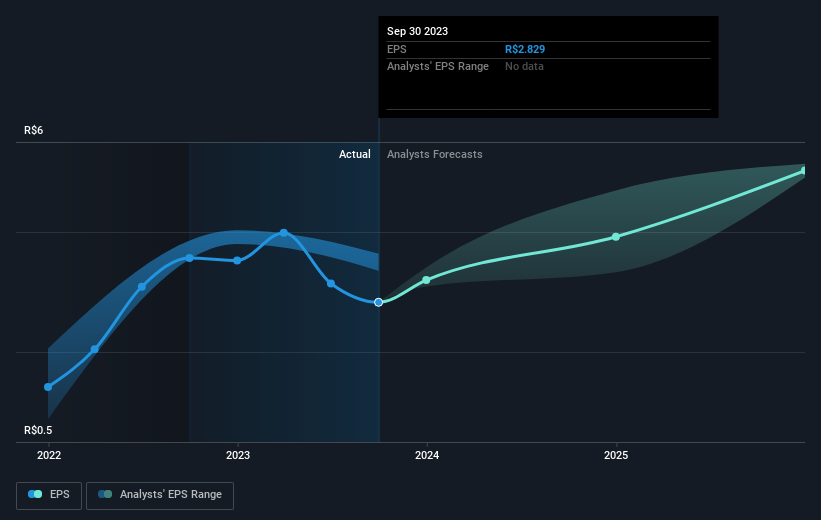
We know that Tupy has improved its bottom line over the last three years, but what does the future have in store? This free interactive report on Tupy's balance sheet strength is a great place to start, if you want to investigate the stock further.
What About Dividends?
When looking at investment returns, it is important to consider the difference between total shareholder return (TSR) and share price return. Whereas the share price return only reflects the change in the share price, the TSR includes the value of dividends (assuming they were reinvested) and the benefit of any discounted capital raising or spin-off. Arguably, the TSR gives a more comprehensive picture of the return generated by a stock. In the case of Tupy, it has a TSR of 49% for the last 5 years. That exceeds its share price return that we previously mentioned. And there's no prize for guessing that the dividend payments largely explain the divergence!
A Different Perspective
Tupy shareholders gained a total return of 5.6% during the year. But that return falls short of the market. It's probably a good sign that the company has an even better long term track record, having provided shareholders with an annual TSR of 8% over five years. It's quite possible the business continues to execute with prowess, even as the share price gains are slowing. It's always interesting to track share price performance over the longer term. But to understand Tupy better, we need to consider many other factors. Consider for instance, the ever-present spectre of investment risk. We've identified 3 warning signs with Tupy , and understanding them should be part of your investment process.
If you like to buy stocks alongside management, then you might just love this free list of companies. (Hint: insiders have been buying them).
Please note, the market returns quoted in this article reflect the market weighted average returns of stocks that currently trade on Brazilian exchanges.
Valuation is complex, but we're here to simplify it.
Discover if Tupy might be undervalued or overvalued with our detailed analysis, featuring fair value estimates, potential risks, dividends, insider trades, and its financial condition.
Access Free AnalysisHave feedback on this article? Concerned about the content? Get in touch with us directly. Alternatively, email editorial-team (at) simplywallst.com.
This article by Simply Wall St is general in nature. We provide commentary based on historical data and analyst forecasts only using an unbiased methodology and our articles are not intended to be financial advice. It does not constitute a recommendation to buy or sell any stock, and does not take account of your objectives, or your financial situation. We aim to bring you long-term focused analysis driven by fundamental data. Note that our analysis may not factor in the latest price-sensitive company announcements or qualitative material. Simply Wall St has no position in any stocks mentioned.
About BOVESPA:TUPY3
Tupy
Engages in the development, manufacture, and sale of cast iron structural components in North America, South and Central Americas, Europe, Asia, Africa, Oceania, and internationally.
Undervalued with adequate balance sheet and pays a dividend.
