
Advertisement
- Belgium
- /
- Construction
- /
- ENXTBR:DEME
Market Participants Recognise DEME Group NV's (EBR:DEME) Earnings Pushing Shares 26% Higher
Despite an already strong run, DEME Group NV (EBR:DEME) shares have been powering on, with a gain of 26% in the last thirty days. The last 30 days bring the annual gain to a very sharp 25%.
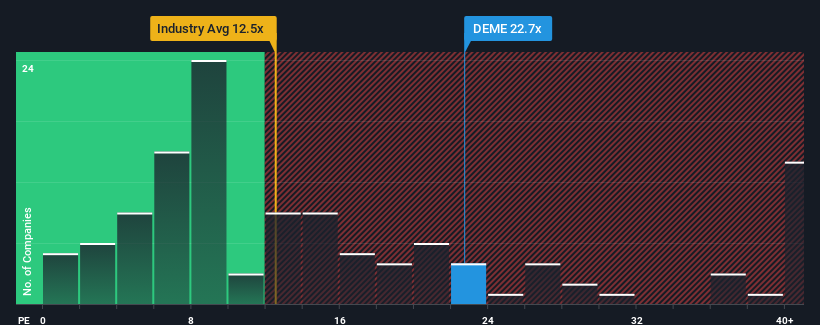
After such a large jump in price, DEME Group may be sending very bearish signals at the moment with a price-to-earnings (or "P/E") ratio of 22.7x, since almost half of all companies in Belgium have P/E ratios under 13x and even P/E's lower than 8x are not unusual. However, the P/E might be quite high for a reason and it requires further investigation to determine if it's justified.
DEME Group certainly has been doing a good job lately as its earnings growth has been positive while most other companies have been seeing their earnings go backwards. It seems that many are expecting the company to continue defying the broader market adversity, which has increased investors’ willingness to pay up for the stock. If not, then existing shareholders might be a little nervous about the viability of the share price.
Check out our latest analysis for DEME Group
How Is DEME Group's Growth Trending?
The only time you'd be truly comfortable seeing a P/E as steep as DEME Group's is when the company's growth is on track to outshine the market decidedly.
Retrospectively, the last year delivered an exceptional 44% gain to the company's bottom line. However, this wasn't enough as the latest three year period has seen a very unpleasant 42% drop in EPS in aggregate. Therefore, it's fair to say the earnings growth recently has been undesirable for the company.
Shifting to the future, estimates from the six analysts covering the company suggest earnings should grow by 21% each year over the next three years. With the market only predicted to deliver 16% per annum, the company is positioned for a stronger earnings result.
In light of this, it's understandable that DEME Group's P/E sits above the majority of other companies. Apparently shareholders aren't keen to offload something that is potentially eyeing a more prosperous future.
The Key Takeaway
Shares in DEME Group have built up some good momentum lately, which has really inflated its P/E. Generally, our preference is to limit the use of the price-to-earnings ratio to establishing what the market thinks about the overall health of a company.
We've established that DEME Group maintains its high P/E on the strength of its forecast growth being higher than the wider market, as expected. At this stage investors feel the potential for a deterioration in earnings isn't great enough to justify a lower P/E ratio. It's hard to see the share price falling strongly in the near future under these circumstances.
The company's balance sheet is another key area for risk analysis. You can assess many of the main risks through our free balance sheet analysis for DEME Group with six simple checks.
It's important to make sure you look for a great company, not just the first idea you come across. So take a peek at this free list of interesting companies with strong recent earnings growth (and a low P/E).
New: Manage All Your Stock Portfolios in One Place
We've created the ultimate portfolio companion for stock investors, and it's free.
• Connect an unlimited number of Portfolios and see your total in one currency
• Be alerted to new Warning Signs or Risks via email or mobile
• Track the Fair Value of your stocks
Have feedback on this article? Concerned about the content? Get in touch with us directly. Alternatively, email editorial-team (at) simplywallst.com.
This article by Simply Wall St is general in nature. We provide commentary based on historical data and analyst forecasts only using an unbiased methodology and our articles are not intended to be financial advice. It does not constitute a recommendation to buy or sell any stock, and does not take account of your objectives, or your financial situation. We aim to bring you long-term focused analysis driven by fundamental data. Note that our analysis may not factor in the latest price-sensitive company announcements or qualitative material. Simply Wall St has no position in any stocks mentioned.
About ENXTBR:DEME
DEME Group
Provides marine solutions in the fields of offshore energy, dredging, marine infrastructure, and environmental works in Belgium, Europe, Africa, the United States, Asia, Oceania, and the Middle East.
Very undervalued with excellent balance sheet.
Similar Companies
Market Insights

Advertisement
Community Narratives
MicroVision will explode future revenue by 380.37% with a vision towards success
Fair Value US$60|98.4% undervalued
TH
Community Contributor
The Indispensable Artery for a New North American Economy
Fair Value CA$132.87|0.7% overvalued
TI
Community Contributor
Recently Updated Narratives
CO

composite32 on Astor Enerji ·
Astor Enerji will surge with a fair value of $140.43 in the next 3 years
Fair Value:₺140.4335.5% undervalued
1 followerusers have followed this narrative
0 commentsusers have commented on this narrative
0 likesusers have liked this narrative
RE

RecMag on Proximus ·
Proximus: The State-Backed Backup Plan with 7% Gross Yield and 15% Currency Upside.
Fair Value:€17.1356.7% undervalued
29 followersusers have followed this narrative
0 commentsusers have commented on this narrative
0 likesusers have liked this narrative
AG


Agricola on IMPACT Silver ·
A case for for IMPACT Silver Corp (TSXV:IPT) to reach USD $4.52 (CAD $6.16) in 2026 (23 bagger in 1 year) and USD $5.76 (CAD $7.89) by 2030
Fair Value:CA$7.8996.2% undervalued
1 followerusers have followed this narrative
0 commentsusers have commented on this narrative
0 likesusers have liked this narrative
Popular Narratives
TH

TheWallstreetKing on MicroVision ·
MicroVision will explode future revenue by 380.37% with a vision towards success
Fair Value:US$6098.4% undervalued
101 followersusers have followed this narrative
10 commentsusers have commented on this narrative
20 likesusers have liked this narrative
OS


oscargarcia on Alphabet ·
The company that turned a verb into a global necessity and basically runs the modern internet, digital ads, smartphones, maps, and AI.
Fair Value:US$3405.8% undervalued
137 followersusers have followed this narrative
6 commentsusers have commented on this narrative
18 likesusers have liked this narrative
AN


AnalystConsensusTarget on NVIDIA ·
NVDA: Expanding AI Demand Will Drive Major Data Center Investments Through 2026
Fair Value:US$250.3929.3% undervalued
929 followersusers have followed this narrative
6 commentsusers have commented on this narrative
22 likesusers have liked this narrative