- Belgium
- /
- Electrical
- /
- ENXTBR:CENER
Market Participants Recognise Cenergy Holdings SA's (EBR:CENER) Earnings
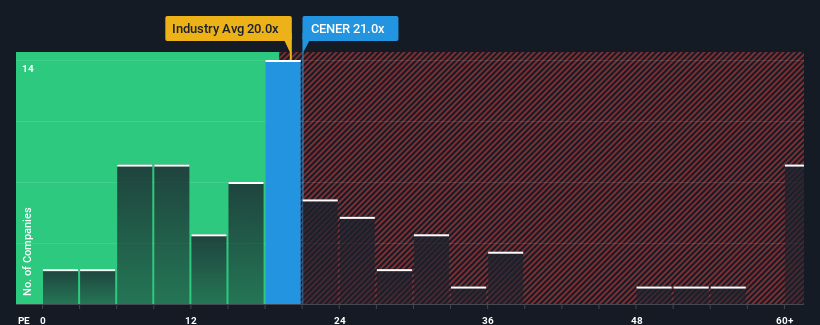
With a price-to-earnings (or "P/E") ratio of 21x Cenergy Holdings SA (EBR:CENER) may be sending bearish signals at the moment, given that almost half of all companies in Belgium have P/E ratios under 14x and even P/E's lower than 8x are not unusual. Nonetheless, we'd need to dig a little deeper to determine if there is a rational basis for the elevated P/E.
Cenergy Holdings certainly has been doing a good job lately as its earnings growth has been positive while most other companies have been seeing their earnings go backwards. The P/E is probably high because investors think the company will continue to navigate the broader market headwinds better than most. You'd really hope so, otherwise you're paying a pretty hefty price for no particular reason.
See our latest analysis for Cenergy Holdings

How Is Cenergy Holdings' Growth Trending?
In order to justify its P/E ratio, Cenergy Holdings would need to produce impressive growth in excess of the market.
Retrospectively, the last year delivered an exceptional 21% gain to the company's bottom line. Pleasingly, EPS has also lifted 193% in aggregate from three years ago, thanks to the last 12 months of growth. Accordingly, shareholders would have probably welcomed those medium-term rates of earnings growth.
Shifting to the future, estimates from the lone analyst covering the company suggest earnings should grow by 56% over the next year. With the market only predicted to deliver 21%, the company is positioned for a stronger earnings result.
In light of this, it's understandable that Cenergy Holdings' P/E sits above the majority of other companies. It seems most investors are expecting this strong future growth and are willing to pay more for the stock.
The Bottom Line On Cenergy Holdings' P/E
We'd say the price-to-earnings ratio's power isn't primarily as a valuation instrument but rather to gauge current investor sentiment and future expectations.
As we suspected, our examination of Cenergy Holdings' analyst forecasts revealed that its superior earnings outlook is contributing to its high P/E. At this stage investors feel the potential for a deterioration in earnings isn't great enough to justify a lower P/E ratio. It's hard to see the share price falling strongly in the near future under these circumstances.
Before you take the next step, you should know about the 1 warning sign for Cenergy Holdings that we have uncovered.
Of course, you might also be able to find a better stock than Cenergy Holdings. So you may wish to see this free collection of other companies that have reasonable P/E ratios and have grown earnings strongly.
New: AI Stock Screener & Alerts
Our new AI Stock Screener scans the market every day to uncover opportunities.
• Dividend Powerhouses (3%+ Yield)
• Undervalued Small Caps with Insider Buying
• High growth Tech and AI Companies
Or build your own from over 50 metrics.
Have feedback on this article? Concerned about the content? Get in touch with us directly. Alternatively, email editorial-team (at) simplywallst.com.
This article by Simply Wall St is general in nature. We provide commentary based on historical data and analyst forecasts only using an unbiased methodology and our articles are not intended to be financial advice. It does not constitute a recommendation to buy or sell any stock, and does not take account of your objectives, or your financial situation. We aim to bring you long-term focused analysis driven by fundamental data. Note that our analysis may not factor in the latest price-sensitive company announcements or qualitative material. Simply Wall St has no position in any stocks mentioned.
About ENXTBR:CENER
Cenergy Holdings
Manufactures and sells aluminium, copper, cables, steel and steel pipes, and other related products in Belgium, Greece, Other European Union countries, Other European countries, the United States, and internationally.
Outstanding track record with excellent balance sheet.
Market Insights
Community Narratives


