
Advertisement
- Australia
- /
- Water Utilities
- /
- ASX:DEM
De.mem Limited's (ASX:DEM) Shares Leap 28% Yet They're Still Not Telling The Full Story
De.mem Limited (ASX:DEM) shareholders would be excited to see that the share price has had a great month, posting a 28% gain and recovering from prior weakness. The bad news is that even after the stocks recovery in the last 30 days, shareholders are still underwater by about 7.4% over the last year.
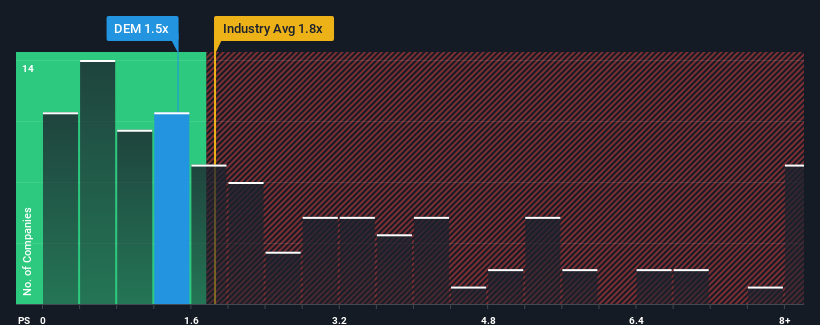
In spite of the firm bounce in price, it's still not a stretch to say that De.mem's price-to-sales (or "P/S") ratio of 1.5x right now seems quite "middle-of-the-road" compared to the Water Utilities industry in Australia, where the median P/S ratio is around 1.8x. Although, it's not wise to simply ignore the P/S without explanation as investors may be disregarding a distinct opportunity or a costly mistake.
View our latest analysis for De.mem
How Has De.mem Performed Recently?
Revenue has risen firmly for De.mem recently, which is pleasing to see. It might be that many expect the respectable revenue performance to wane, which has kept the P/S from rising. If you like the company, you'd be hoping this isn't the case so that you could potentially pick up some stock while it's not quite in favour.
Want the full picture on earnings, revenue and cash flow for the company? Then our free report on De.mem will help you shine a light on its historical performance.What Are Revenue Growth Metrics Telling Us About The P/S?
De.mem's P/S ratio would be typical for a company that's only expected to deliver moderate growth, and importantly, perform in line with the industry.
Taking a look back first, we see that the company grew revenue by an impressive 17% last year. The strong recent performance means it was also able to grow revenue by 66% in total over the last three years. Accordingly, shareholders would have definitely welcomed those medium-term rates of revenue growth.
When compared to the industry's one-year growth forecast of 7.4%, the most recent medium-term revenue trajectory is noticeably more alluring
In light of this, it's curious that De.mem's P/S sits in line with the majority of other companies. It may be that most investors are not convinced the company can maintain its recent growth rates.
The Key Takeaway
De.mem appears to be back in favour with a solid price jump bringing its P/S back in line with other companies in the industry We'd say the price-to-sales ratio's power isn't primarily as a valuation instrument but rather to gauge current investor sentiment and future expectations.
We didn't quite envision De.mem's P/S sitting in line with the wider industry, considering the revenue growth over the last three-year is higher than the current industry outlook. There could be some unobserved threats to revenue preventing the P/S ratio from matching this positive performance. It appears some are indeed anticipating revenue instability, because the persistence of these recent medium-term conditions would normally provide a boost to the share price.
You should always think about risks. Case in point, we've spotted 3 warning signs for De.mem you should be aware of, and 1 of them is concerning.
If strong companies turning a profit tickle your fancy, then you'll want to check out this free list of interesting companies that trade on a low P/E (but have proven they can grow earnings).
New: Manage All Your Stock Portfolios in One Place
We've created the ultimate portfolio companion for stock investors, and it's free.
• Connect an unlimited number of Portfolios and see your total in one currency
• Be alerted to new Warning Signs or Risks via email or mobile
• Track the Fair Value of your stocks
Have feedback on this article? Concerned about the content? Get in touch with us directly. Alternatively, email editorial-team (at) simplywallst.com.
This article by Simply Wall St is general in nature. We provide commentary based on historical data and analyst forecasts only using an unbiased methodology and our articles are not intended to be financial advice. It does not constitute a recommendation to buy or sell any stock, and does not take account of your objectives, or your financial situation. We aim to bring you long-term focused analysis driven by fundamental data. Note that our analysis may not factor in the latest price-sensitive company announcements or qualitative material. Simply Wall St has no position in any stocks mentioned.
About ASX:DEM
De.mem
Designs, builds, owns, and operates modern water treatment systems for industrial, municipal, and residential sectors in Australia, Singapore, and Germany.
Flawless balance sheet and good value.
Market Insights

Advertisement
Community Narratives
The company that turned a verb into a global necessity and basically runs the modern internet, digital ads, smartphones, maps, and AI.
Fair Value US$300.00|10.8% undervalued
OS
Community Contributor
Flowers Foods Pays A Fair Price For Health
Fair Value US$16.12|22.0% undervalued
NV
Community Contributor
TMX Group will thrive with 33.3% profit margin and enduring market moat
Fair Value CA$49.90|3.8% overvalued
LI
Community Contributor