
Advertisement
- Australia
- /
- Infrastructure
- /
- ASX:SRH
These 4 Measures Indicate That Saferoads Holdings (ASX:SRH) Is Using Debt Extensively
Legendary fund manager Li Lu (who Charlie Munger backed) once said, 'The biggest investment risk is not the volatility of prices, but whether you will suffer a permanent loss of capital.' When we think about how risky a company is, we always like to look at its use of debt, since debt overload can lead to ruin. We can see that Saferoads Holdings Limited (ASX:SRH) does use debt in its business. But the more important question is: how much risk is that debt creating?
Why Does Debt Bring Risk?
Debt and other liabilities become risky for a business when it cannot easily fulfill those obligations, either with free cash flow or by raising capital at an attractive price. Ultimately, if the company can't fulfill its legal obligations to repay debt, shareholders could walk away with nothing. However, a more common (but still painful) scenario is that it has to raise new equity capital at a low price, thus permanently diluting shareholders. Of course, debt can be an important tool in businesses, particularly capital heavy businesses. The first thing to do when considering how much debt a business uses is to look at its cash and debt together.
See our latest analysis for Saferoads Holdings
What Is Saferoads Holdings's Debt?
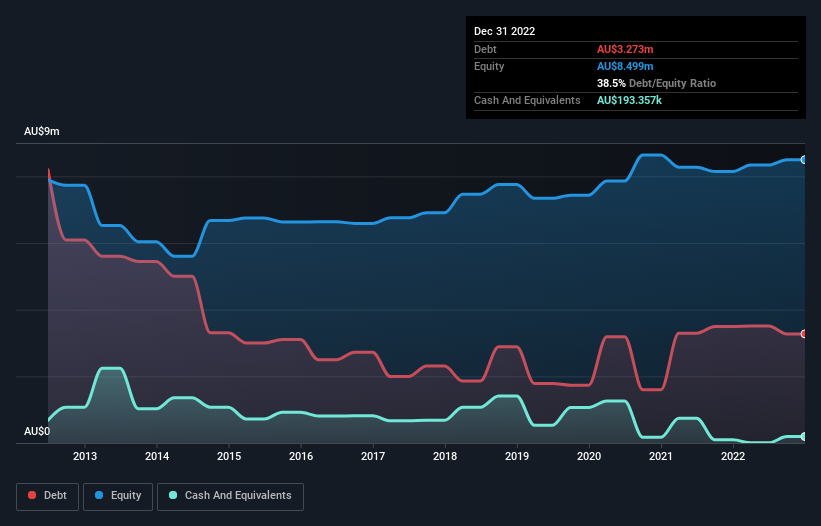
The image below, which you can click on for greater detail, shows that Saferoads Holdings had debt of AU$3.27m at the end of December 2022, a reduction from AU$3.49m over a year. However, it does have AU$193.4k in cash offsetting this, leading to net debt of about AU$3.08m.
A Look At Saferoads Holdings' Liabilities
Zooming in on the latest balance sheet data, we can see that Saferoads Holdings had liabilities of AU$4.70m due within 12 months and liabilities of AU$3.06m due beyond that. Offsetting this, it had AU$193.4k in cash and AU$2.03m in receivables that were due within 12 months. So its liabilities outweigh the sum of its cash and (near-term) receivables by AU$5.54m.
When you consider that this deficiency exceeds the company's AU$4.87m market capitalization, you might well be inclined to review the balance sheet intently. Hypothetically, extremely heavy dilution would be required if the company were forced to pay down its liabilities by raising capital at the current share price.
We measure a company's debt load relative to its earnings power by looking at its net debt divided by its earnings before interest, tax, depreciation, and amortization (EBITDA) and by calculating how easily its earnings before interest and tax (EBIT) cover its interest expense (interest cover). The advantage of this approach is that we take into account both the absolute quantum of debt (with net debt to EBITDA) and the actual interest expenses associated with that debt (with its interest cover ratio).
While Saferoads Holdings has a quite reasonable net debt to EBITDA multiple of 1.9, its interest cover seems weak, at 2.2. In large part that's it has so much depreciation and amortisation. While companies often boast that these charges are non-cash, most such businesses will therefore require ongoing investment (that is not expensed.) Either way there's no doubt the stock is using meaningful leverage. We also note that Saferoads Holdings improved its EBIT from a last year's loss to a positive AU$614k. The balance sheet is clearly the area to focus on when you are analysing debt. But you can't view debt in total isolation; since Saferoads Holdings will need earnings to service that debt. So when considering debt, it's definitely worth looking at the earnings trend. Click here for an interactive snapshot.
Finally, a company can only pay off debt with cold hard cash, not accounting profits. So it is important to check how much of its earnings before interest and tax (EBIT) converts to actual free cash flow. Happily for any shareholders, Saferoads Holdings actually produced more free cash flow than EBIT over the last year. There's nothing better than incoming cash when it comes to staying in your lenders' good graces.
Our View
Neither Saferoads Holdings's ability to cover its interest expense with its EBIT nor its level of total liabilities gave us confidence in its ability to take on more debt. But the good news is it seems to be able to convert EBIT to free cash flow with ease. It's also worth noting that Saferoads Holdings is in the Infrastructure industry, which is often considered to be quite defensive. We think that Saferoads Holdings's debt does make it a bit risky, after considering the aforementioned data points together. That's not necessarily a bad thing, since leverage can boost returns on equity, but it is something to be aware of. When analysing debt levels, the balance sheet is the obvious place to start. However, not all investment risk resides within the balance sheet - far from it. These risks can be hard to spot. Every company has them, and we've spotted 2 warning signs for Saferoads Holdings you should know about.
At the end of the day, it's often better to focus on companies that are free from net debt. You can access our special list of such companies (all with a track record of profit growth). It's free.
New: Manage All Your Stock Portfolios in One Place
We've created the ultimate portfolio companion for stock investors, and it's free.
• Connect an unlimited number of Portfolios and see your total in one currency
• Be alerted to new Warning Signs or Risks via email or mobile
• Track the Fair Value of your stocks
Have feedback on this article? Concerned about the content? Get in touch with us directly. Alternatively, email editorial-team (at) simplywallst.com.
This article by Simply Wall St is general in nature. We provide commentary based on historical data and analyst forecasts only using an unbiased methodology and our articles are not intended to be financial advice. It does not constitute a recommendation to buy or sell any stock, and does not take account of your objectives, or your financial situation. We aim to bring you long-term focused analysis driven by fundamental data. Note that our analysis may not factor in the latest price-sensitive company announcements or qualitative material. Simply Wall St has no position in any stocks mentioned.
About ASX:SRH
Saferoads Holdings
Provides road safety products and solutions in Australia, Europe, Asia, New Zealand, and the United States.
Flawless balance sheet and good value.
Market Insights

Advertisement
Community Narratives
MINISO's fair value is projected at 26.69 with an anticipated PE ratio shift of 20x
Fair Value US$24.03|11.0% undervalued
BE
Community Contributor
Procter & Gamble: A Dividend Giant Facing Slowing Growth
Fair Value US$119.81|23.3% overvalued
AN
Community Contributor
Eli Lilly's Future Growth Driven by Tirzepatide and Favorable Market Conditions
Fair Value US$1.19k|13.8% undervalued
EA
Community Contributor