
Advertisement
Declining Stock and Decent Financials: Is The Market Wrong About K&S Corporation Limited (ASX:KSC)?
It is hard to get excited after looking at K&S' (ASX:KSC) recent performance, when its stock has declined 20% over the past three months. However, stock prices are usually driven by a company’s financials over the long term, which in this case look pretty respectable. Specifically, we decided to study K&S' ROE in this article.
Return on equity or ROE is a key measure used to assess how efficiently a company's management is utilizing the company's capital. In short, ROE shows the profit each dollar generates with respect to its shareholder investments.
View our latest analysis for K&S
How Do You Calculate Return On Equity?
The formula for return on equity is:
Return on Equity = Net Profit (from continuing operations) ÷ Shareholders' Equity
So, based on the above formula, the ROE for K&S is:
9.1% = AU$30m ÷ AU$328m (Based on the trailing twelve months to December 2023).
The 'return' is the amount earned after tax over the last twelve months. That means that for every A$1 worth of shareholders' equity, the company generated A$0.09 in profit.
What Has ROE Got To Do With Earnings Growth?
So far, we've learned that ROE is a measure of a company's profitability. Based on how much of its profits the company chooses to reinvest or "retain", we are then able to evaluate a company's future ability to generate profits. Assuming all else is equal, companies that have both a higher return on equity and higher profit retention are usually the ones that have a higher growth rate when compared to companies that don't have the same features.
K&S' Earnings Growth And 9.1% ROE
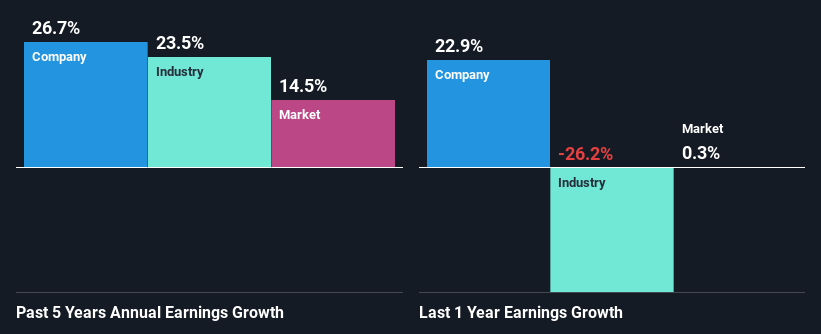
At first glance, K&S' ROE doesn't look very promising. A quick further study shows that the company's ROE doesn't compare favorably to the industry average of 12% either. Despite this, surprisingly, K&S saw an exceptional 27% net income growth over the past five years. Therefore, there could be other reasons behind this growth. For instance, the company has a low payout ratio or is being managed efficiently.
We then performed a comparison between K&S' net income growth with the industry, which revealed that the company's growth is similar to the average industry growth of 23% in the same 5-year period.
Earnings growth is a huge factor in stock valuation. What investors need to determine next is if the expected earnings growth, or the lack of it, is already built into the share price. Doing so will help them establish if the stock's future looks promising or ominous. One good indicator of expected earnings growth is the P/E ratio which determines the price the market is willing to pay for a stock based on its earnings prospects. So, you may want to check if K&S is trading on a high P/E or a low P/E, relative to its industry.
Is K&S Using Its Retained Earnings Effectively?
The high three-year median payout ratio of 78% (implying that it keeps only 22% of profits) for K&S suggests that the company's growth wasn't really hampered despite it returning most of the earnings to its shareholders.
Moreover, K&S is determined to keep sharing its profits with shareholders which we infer from its long history of paying a dividend for at least ten years.
Summary
In total, it does look like K&S has some positive aspects to its business. That is, quite an impressive growth in earnings. However, the low profit retention means that the company's earnings growth could have been higher, had it been reinvesting a higher portion of its profits. Until now, we have only just grazed the surface of the company's past performance by looking at the company's fundamentals. To gain further insights into K&S' past profit growth, check out this visualization of past earnings, revenue and cash flows.
Valuation is complex, but we're here to simplify it.
Discover if K&S might be undervalued or overvalued with our detailed analysis, featuring fair value estimates, potential risks, dividends, insider trades, and its financial condition.
Access Free AnalysisHave feedback on this article? Concerned about the content? Get in touch with us directly. Alternatively, email editorial-team (at) simplywallst.com.
This article by Simply Wall St is general in nature. We provide commentary based on historical data and analyst forecasts only using an unbiased methodology and our articles are not intended to be financial advice. It does not constitute a recommendation to buy or sell any stock, and does not take account of your objectives, or your financial situation. We aim to bring you long-term focused analysis driven by fundamental data. Note that our analysis may not factor in the latest price-sensitive company announcements or qualitative material. Simply Wall St has no position in any stocks mentioned.
Have feedback on this article? Concerned about the content? Get in touch with us directly. Alternatively, email editorial-team@simplywallst.com
About ASX:KSC
K&S
Engages in the transportation and logistics, warehousing, and fuel distribution businesses in Australia and New Zealand.
Excellent balance sheet second-rate dividend payer.
Market Insights

Advertisement
Community Narratives
The company that turned a verb into a global necessity and basically runs the modern internet, digital ads, smartphones, maps, and AI.
Fair Value US$300.00|10.8% undervalued
OS
Community Contributor
Flowers Foods Pays A Fair Price For Health
Fair Value US$16.12|22.0% undervalued
NV
Community Contributor
TMX Group will thrive with 33.3% profit margin and enduring market moat
Fair Value CA$49.90|3.8% overvalued
LI
Community Contributor