
Advertisement
Here's Why We're Not At All Concerned With Tuas' (ASX:TUA) Cash Burn Situation
There's no doubt that money can be made by owning shares of unprofitable businesses. Indeed, Tuas (ASX:TUA) stock is up 131% in the last year, providing strong gains for shareholders. But the harsh reality is that very many loss making companies burn through all their cash and go bankrupt.
In light of its strong share price run, we think now is a good time to investigate how risky Tuas' cash burn is. For the purpose of this article, we'll define cash burn as the amount of cash the company is spending each year to fund its growth (also called its negative free cash flow). We'll start by comparing its cash burn with its cash reserves in order to calculate its cash runway.
See our latest analysis for Tuas
How Long Is Tuas' Cash Runway?
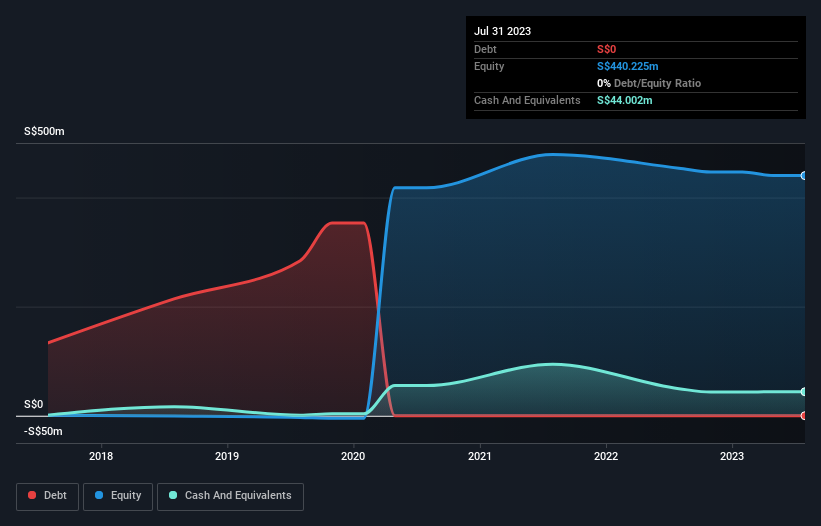
A company's cash runway is calculated by dividing its cash hoard by its cash burn. As at July 2023, Tuas had cash of S$44m and no debt. Importantly, its cash burn was S$4.6m over the trailing twelve months. Therefore, from July 2023 it had 9.5 years of cash runway. Even though this is but one measure of the company's cash burn, the thought of such a long cash runway warms our bellies in a comforting way. You can see how its cash balance has changed over time in the image below.
How Well Is Tuas Growing?
Given our focus on Tuas' cash burn, we're delighted to see that it reduced its cash burn by a nifty 90%. And revenue is up 50% in that same period; also a good sign. Overall, we'd say its growth is rather impressive. While the past is always worth studying, it is the future that matters most of all. So you might want to take a peek at how much the company is expected to grow in the next few years.
How Hard Would It Be For Tuas To Raise More Cash For Growth?
There's no doubt Tuas seems to be in a fairly good position, when it comes to managing its cash burn, but even if it's only hypothetical, it's always worth asking how easily it could raise more money to fund growth. Issuing new shares, or taking on debt, are the most common ways for a listed company to raise more money for its business. Many companies end up issuing new shares to fund future growth. By looking at a company's cash burn relative to its market capitalisation, we gain insight on how much shareholders would be diluted if the company needed to raise enough cash to cover another year's cash burn.
Tuas' cash burn of S$4.6m is about 0.4% of its S$1.3b market capitalisation. So it could almost certainly just borrow a little to fund another year's growth, or else easily raise the cash by issuing a few shares.
How Risky Is Tuas' Cash Burn Situation?
As you can probably tell by now, we're not too worried about Tuas' cash burn. In particular, we think its cash burn reduction stands out as evidence that the company is well on top of its spending. But it's fair to say that its cash burn relative to its market cap was also very reassuring. Taking all the factors in this report into account, we're not at all worried about its cash burn, as the business appears well capitalized to spend as needs be. Readers need to have a sound understanding of business risks before investing in a stock, and we've spotted 1 warning sign for Tuas that potential shareholders should take into account before putting money into a stock.
If you would prefer to check out another company with better fundamentals, then do not miss this free list of interesting companies, that have HIGH return on equity and low debt or this list of stocks which are all forecast to grow.
Valuation is complex, but we're here to simplify it.
Discover if Tuas might be undervalued or overvalued with our detailed analysis, featuring fair value estimates, potential risks, dividends, insider trades, and its financial condition.
Access Free AnalysisHave feedback on this article? Concerned about the content? Get in touch with us directly. Alternatively, email editorial-team (at) simplywallst.com.
This article by Simply Wall St is general in nature. We provide commentary based on historical data and analyst forecasts only using an unbiased methodology and our articles are not intended to be financial advice. It does not constitute a recommendation to buy or sell any stock, and does not take account of your objectives, or your financial situation. We aim to bring you long-term focused analysis driven by fundamental data. Note that our analysis may not factor in the latest price-sensitive company announcements or qualitative material. Simply Wall St has no position in any stocks mentioned.
About ASX:TUA
Flawless balance sheet with acceptable track record.
Market Insights

Advertisement
Community Narratives
Finding The True Value Of A Logistics Powerhouse
Fair Value US$95.21|8.4% undervalued
NV
Community Contributor
Paradigm Biopharmaceuticals Will Lead Osteoarthritis Treatment with Zilosul's FDA Success
Fair Value AU$5.50|92.1% undervalued
AM
Community Contributor
Barrick Mining (ABX:CA): A Gold Hedge against a U.S. Shutdown
Fair Value CA$60.00|24.2% undervalued
GM
Community Contributor