Did You Participate In Any Of Harvest Technology Group's (ASX:HTG) Incredible 828% Return?
For us, stock picking is in large part the hunt for the truly magnificent stocks. Mistakes are inevitable, but a single top stock pick can cover any losses, and so much more. One such superstar is Harvest Technology Group Ltd (ASX:HTG), which saw its share price soar 786% in three years. Meanwhile the share price is 13% higher than it was a week ago.
We love happy stories like this one. The company should be really proud of that performance!
View our latest analysis for Harvest Technology Group
Given that Harvest Technology Group didn't make a profit in the last twelve months, we'll focus on revenue growth to form a quick view of its business development. When a company doesn't make profits, we'd generally expect to see good revenue growth. Some companies are willing to postpone profitability to grow revenue faster, but in that case one does expect good top-line growth.
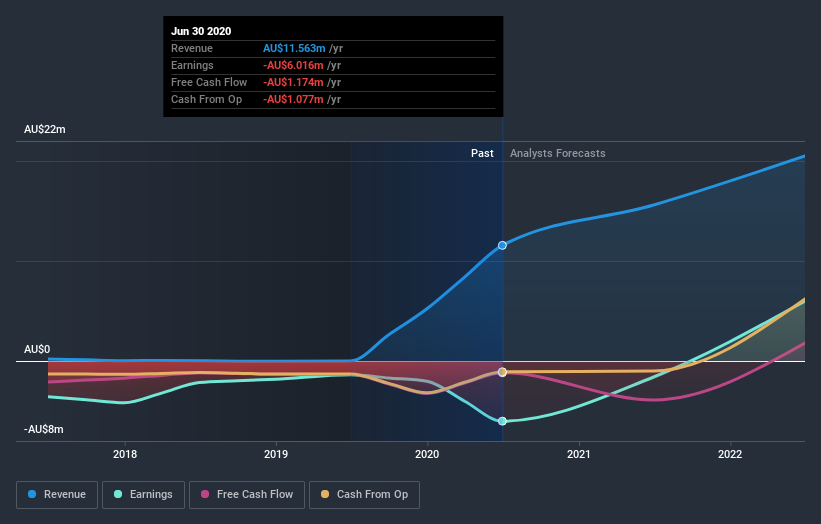
Over the last three years Harvest Technology Group has grown its revenue at 119% annually. That's much better than most loss-making companies. In light of this attractive revenue growth, it seems somewhat appropriate that the share price has been rocketing, boasting a gain of 107% per year, over the same period. Despite the strong run, top performers like Harvest Technology Group have been known to go on winning for decades. So we'd recommend you take a closer look at this one, or even put it on your watchlist.
The graphic below depicts how earnings and revenue have changed over time (unveil the exact values by clicking on the image).

Take a more thorough look at Harvest Technology Group's financial health with this free report on its balance sheet.
What about the Total Shareholder Return (TSR)?
Investors should note that there's a difference between Harvest Technology Group's total shareholder return (TSR) and its share price change, which we've covered above. The TSR attempts to capture the value of dividends (as if they were reinvested) as well as any spin-offs or discounted capital raisings offered to shareholders. Harvest Technology Group hasn't been paying dividends, but its TSR of 828% exceeds its share price return of 786%, implying it has either spun-off a business, or raised capital at a discount; thereby providing additional value to shareholders.
A Different Perspective
It's nice to see that Harvest Technology Group shareholders have gained 716% (in total) over the last year. So this year's TSR was actually better than the three-year TSR (annualized) of 110%. Given the track record of solid returns over varying time frames, it might be worth putting Harvest Technology Group on your watchlist. It's always interesting to track share price performance over the longer term. But to understand Harvest Technology Group better, we need to consider many other factors. For instance, we've identified 3 warning signs for Harvest Technology Group (1 is a bit unpleasant) that you should be aware of.
Of course Harvest Technology Group may not be the best stock to buy. So you may wish to see this free collection of growth stocks.
Please note, the market returns quoted in this article reflect the market weighted average returns of stocks that currently trade on AU exchanges.
If you’re looking to trade Harvest Technology Group, open an account with the lowest-cost* platform trusted by professionals, Interactive Brokers. Their clients from over 200 countries and territories trade stocks, options, futures, forex, bonds and funds worldwide from a single integrated account. Promoted
The New Payments ETF Is Live on NASDAQ:
Money is moving to real-time rails, and a newly listed ETF now gives investors direct exposure. Fast settlement. Institutional custody. Simple access.
Explore how this launch could reshape portfolios
Sponsored ContentValuation is complex, but we're here to simplify it.
Discover if Harvest Technology Group might be undervalued or overvalued with our detailed analysis, featuring fair value estimates, potential risks, dividends, insider trades, and its financial condition.
Access Free AnalysisThis article by Simply Wall St is general in nature. It does not constitute a recommendation to buy or sell any stock, and does not take account of your objectives, or your financial situation. We aim to bring you long-term focused analysis driven by fundamental data. Note that our analysis may not factor in the latest price-sensitive company announcements or qualitative material. Simply Wall St has no position in any stocks mentioned.
*Interactive Brokers Rated Lowest Cost Broker by StockBrokers.com Annual Online Review 2020
Have feedback on this article? Concerned about the content? Get in touch with us directly. Alternatively, email editorial-team@simplywallst.com.
About ASX:HTG
Harvest Technology Group
Engages in the provision of remote communications technology based on data transmission protocols in Australia.
Medium-low risk with weak fundamentals.
Market Insights
Weekly Picks

Early mover in a fast growing industry. Likely to experience share price volatility as they scale


A case for CA$31.80 (undiluted), aka 8,616% upside from CA$0.37 (an 86 bagger!).


Moderation and Stabilisation: HOLD: Fair Price based on a 4-year Cycle is $12.08
Recently Updated Narratives

Airbnb Stock: Platform Growth in a World of Saturation and Scrutiny

Adobe Stock: AI-Fueled ARR Growth Pushes Guidance Higher, But Cost Pressures Loom

Thomson Reuters Stock: When Legal Intelligence Becomes Mission-Critical Infrastructure
Popular Narratives


Crazy Undervalued 42 Baggers Silver Play (Active & Running Mine)


NVDA: Expanding AI Demand Will Drive Major Data Center Investments Through 2026


The AI Infrastructure Giant Grows Into Its Valuation
Trending Discussion


