Advertisement
Should We Worry About Codan Limited's (ASX:CDA) P/E Ratio?
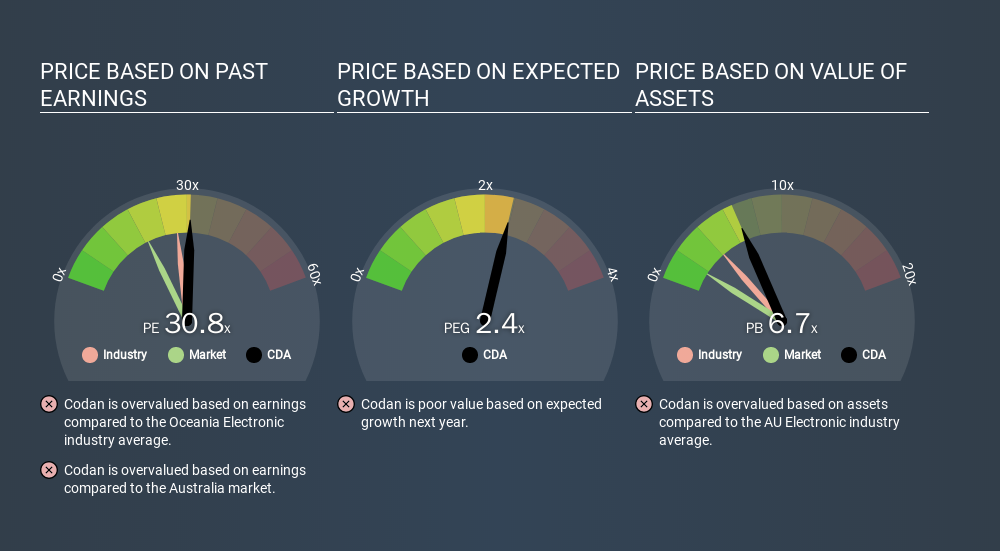
The goal of this article is to teach you how to use price to earnings ratios (P/E ratios). We'll apply a basic P/E ratio analysis to Codan Limited's (ASX:CDA), to help you decide if the stock is worth further research. Codan has a price to earnings ratio of 30.77, based on the last twelve months. That means that at current prices, buyers pay A$30.77 for every A$1 in trailing yearly profits.
Check out our latest analysis for Codan
How Do You Calculate A P/E Ratio?
The formula for P/E is:
Price to Earnings Ratio = Share Price ÷ Earnings per Share (EPS)
Or for Codan:
P/E of 30.77 = A$7.85 ÷ A$0.26 (Based on the trailing twelve months to June 2019.)
Is A High Price-to-Earnings Ratio Good?
A higher P/E ratio means that buyers have to pay a higher price for each A$1 the company has earned over the last year. That is not a good or a bad thing per se, but a high P/E does imply buyers are optimistic about the future.
Does Codan Have A Relatively High Or Low P/E For Its Industry?
One good way to get a quick read on what market participants expect of a company is to look at its P/E ratio. You can see in the image below that the average P/E (27.4) for companies in the electronic industry is lower than Codan's P/E.
Its relatively high P/E ratio indicates that Codan shareholders think it will perform better than other companies in its industry classification. The market is optimistic about the future, but that doesn't guarantee future growth. So further research is always essential. I often monitor director buying and selling.
How Growth Rates Impact P/E Ratios
Probably the most important factor in determining what P/E a company trades on is the earnings growth. When earnings grow, the 'E' increases, over time. That means even if the current P/E is high, it will reduce over time if the share price stays flat. Then, a lower P/E should attract more buyers, pushing the share price up.
Codan's earnings per share grew by -9.2% in the last twelve months. And earnings per share have improved by 37% annually, over the last five years.
A Limitation: P/E Ratios Ignore Debt and Cash In The Bank
Don't forget that the P/E ratio considers market capitalization. Thus, the metric does not reflect cash or debt held by the company. The exact same company would hypothetically deserve a higher P/E ratio if it had a strong balance sheet, than if it had a weak one with lots of debt, because a cashed up company can spend on growth.
Such spending might be good or bad, overall, but the key point here is that you need to look at debt to understand the P/E ratio in context.
So What Does Codan's Balance Sheet Tell Us?
Since Codan holds net cash of AU$38m, it can spend on growth, justifying a higher P/E ratio than otherwise.
The Verdict On Codan's P/E Ratio
Codan's P/E is 30.8 which is above average (18.9) in its market. EPS was up modestly better over the last twelve months. And the healthy balance sheet means the company can sustain growth while the P/E suggests shareholders think it will.
When the market is wrong about a stock, it gives savvy investors an opportunity. If the reality for a company is better than it expects, you can make money by buying and holding for the long term. So this free report on the analyst consensus forecasts could help you make a master move on this stock.
Of course you might be able to find a better stock than Codan. So you may wish to see this free collection of other companies that have grown earnings strongly.
If you spot an error that warrants correction, please contact the editor at editorial-team@simplywallst.com. This article by Simply Wall St is general in nature. It does not constitute a recommendation to buy or sell any stock, and does not take account of your objectives, or your financial situation. Simply Wall St has no position in the stocks mentioned.
We aim to bring you long-term focused research analysis driven by fundamental data. Note that our analysis may not factor in the latest price-sensitive company announcements or qualitative material. Thank you for reading.
About ASX:CDA
Codan
Develops technology solutions for United Nations organizations, security and military agencies, government departments, corporates, individuals consumers, and small-scale miners.
Outstanding track record with excellent balance sheet.
Similar Companies
Market Insights


Advertisement
Weekly Picks
CE


Ceazar on Conexeu Sciences ·
This small biotech is developing technology that could potentially change how tissue is rebuilt
Fair Value:US$25.3447.6% undervalued
41 followersusers have followed this narrative
0 commentsusers have commented on this narrative
5 likesusers have liked this narrative
HE


HedgeY on Quanta Services ·
The Picks-and-Shovels Leader of the Grid Supercycle
Fair Value:US$7101.1% undervalued
52 followersusers have followed this narrative
0 commentsusers have commented on this narrative
5 likesusers have liked this narrative
FU

FundamentalFlow on Karman Holdings ·
KRMN — Karman Space & Defense: Down 58% from Peak, Is the Market Mispricing a Hypergrowth Defense Compounder?
Fair Value:US$105.652.3% undervalued
31 followersusers have followed this narrative
2 commentsusers have commented on this narrative
15 likesusers have liked this narrative
DO


Double_Bubbler on Invinity Energy Systems ·
Invinity Energy Systems: All About That BESS
Fair Value:UK£162.2% undervalued
40 followersusers have followed this narrative
0 commentsusers have commented on this narrative
6 likesusers have liked this narrative
Recently Updated Narratives
DA


davidlsander on Vulcan Minerals ·
Uncovering The Hidden Annuity: Why Vulcan Minerals (TSXV:VUL) Trades At A Massive Discount To Its Sum-Of-The-Parts
Fair Value:CA$2.2378.7% undervalued
1 followerusers have followed this narrative
0 commentsusers have commented on this narrative
0 likesusers have liked this narrative
RO


Rog on CTT - Correios De Portugal ·
Why CTT benefits in multiple ways right now
Fair Value:€7.6721.6% undervalued
4 followersusers have followed this narrative
0 commentsusers have commented on this narrative
0 likesusers have liked this narrative
TA


Talos on Adecoagro ·
Why a "2026 Super El Nino" is the Ultimate Hedge for Tech-Heavy Portfolios
Fair Value:US$18.2849.5% undervalued
2 followersusers have followed this narrative
0 commentsusers have commented on this narrative
0 likesusers have liked this narrative
Popular Narratives
MA


martinarauz on Nu Holdings ·
Investment Analysis (May 2026)
Fair Value:US$22.7444.1% undervalued
67 followersusers have followed this narrative
0 commentsusers have commented on this narrative
16 likesusers have liked this narrative
HA


HarishPK on Adobe ·
Adobe: A Probabilistic Case for Undervaluation
Fair Value:US$319.9639.0% undervalued
60 followersusers have followed this narrative
9 commentsusers have commented on this narrative
17 likesusers have liked this narrative
NI

niteco on Honeywell International ·
Honeywell - The Demand-Side of the AI Infrastructure
Fair Value:US$320.1928.5% undervalued
52 followersusers have followed this narrative
0 commentsusers have commented on this narrative
19 likesusers have liked this narrative

