Stock Analysis


Warren Buffett famously said, 'Volatility is far from synonymous with risk.' When we think about how risky a company is, we always like to look at its use of debt, since debt overload can lead to ruin. As with many other companies Xero Limited (ASX:XRO) makes use of debt. But the real question is whether this debt is making the company risky.
What Risk Does Debt Bring?
Debt assists a business until the business has trouble paying it off, either with new capital or with free cash flow. If things get really bad, the lenders can take control of the business. However, a more frequent (but still costly) occurrence is where a company must issue shares at bargain-basement prices, permanently diluting shareholders, just to shore up its balance sheet. Of course, the upside of debt is that it often represents cheap capital, especially when it replaces dilution in a company with the ability to reinvest at high rates of return. The first thing to do when considering how much debt a business uses is to look at its cash and debt together.
See our latest analysis for Xero
What Is Xero's Debt?
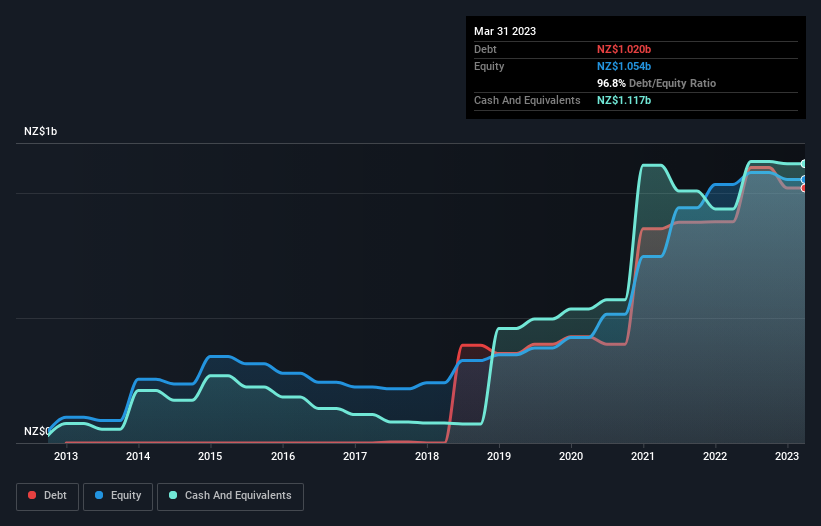
You can click the graphic below for the historical numbers, but it shows that as of March 2023 Xero had NZ$1.02b of debt, an increase on NZ$884.8m, over one year. However, it does have NZ$1.12b in cash offsetting this, leading to net cash of NZ$97.4m.
How Healthy Is Xero's Balance Sheet?
We can see from the most recent balance sheet that Xero had liabilities of NZ$255.1m falling due within a year, and liabilities of NZ$1.18b due beyond that. Offsetting this, it had NZ$1.12b in cash and NZ$69.5m in receivables that were due within 12 months. So its liabilities total NZ$249.5m more than the combination of its cash and short-term receivables.
Having regard to Xero's size, it seems that its liquid assets are well balanced with its total liabilities. So it's very unlikely that the NZ$18.8b company is short on cash, but still worth keeping an eye on the balance sheet. Despite its noteworthy liabilities, Xero boasts net cash, so it's fair to say it does not have a heavy debt load!
Even more impressive was the fact that Xero grew its EBIT by 159% over twelve months. That boost will make it even easier to pay down debt going forward. There's no doubt that we learn most about debt from the balance sheet. But it is future earnings, more than anything, that will determine Xero's ability to maintain a healthy balance sheet going forward. So if you want to see what the professionals think, you might find this free report on analyst profit forecasts to be interesting.
Finally, a company can only pay off debt with cold hard cash, not accounting profits. Xero may have net cash on the balance sheet, but it is still interesting to look at how well the business converts its earnings before interest and tax (EBIT) to free cash flow, because that will influence both its need for, and its capacity to manage debt. Over the last three years, Xero recorded free cash flow worth a fulsome 81% of its EBIT, which is stronger than we'd usually expect. That positions it well to pay down debt if desirable to do so.
Summing Up
While it is always sensible to look at a company's total liabilities, it is very reassuring that Xero has NZ$97.4m in net cash. The cherry on top was that in converted 81% of that EBIT to free cash flow, bringing in NZ$105m. So is Xero's debt a risk? It doesn't seem so to us. Even though Xero lost money on the bottom line, its positive EBIT suggests the business itself has potential. So you might want to check out how earnings have been trending over the last few years.
At the end of the day, it's often better to focus on companies that are free from net debt. You can access our special list of such companies (all with a track record of profit growth). It's free.
Valuation is complex, but we're helping make it simple.
Find out whether Xero is potentially over or undervalued by checking out our comprehensive analysis, which includes fair value estimates, risks and warnings, dividends, insider transactions and financial health.
View the Free AnalysisHave feedback on this article? Concerned about the content? Get in touch with us directly. Alternatively, email editorial-team (at) simplywallst.com.
This article by Simply Wall St is general in nature. We provide commentary based on historical data and analyst forecasts only using an unbiased methodology and our articles are not intended to be financial advice. It does not constitute a recommendation to buy or sell any stock, and does not take account of your objectives, or your financial situation. We aim to bring you long-term focused analysis driven by fundamental data. Note that our analysis may not factor in the latest price-sensitive company announcements or qualitative material. Simply Wall St has no position in any stocks mentioned.
About ASX:XRO
Xero
A software as a service company, provides online business solutions for small businesses and their advisors in Australia, New Zealand, and internationally.
Flawless balance sheet with high growth potential.
