
Advertisement
Shekel Brainweigh Ltd. (ASX:SBW) Shares Fly 29% But Investors Aren't Buying For Growth
Shekel Brainweigh Ltd. (ASX:SBW) shareholders would be excited to see that the share price has had a great month, posting a 29% gain and recovering from prior weakness. But the last month did very little to improve the 53% share price decline over the last year.
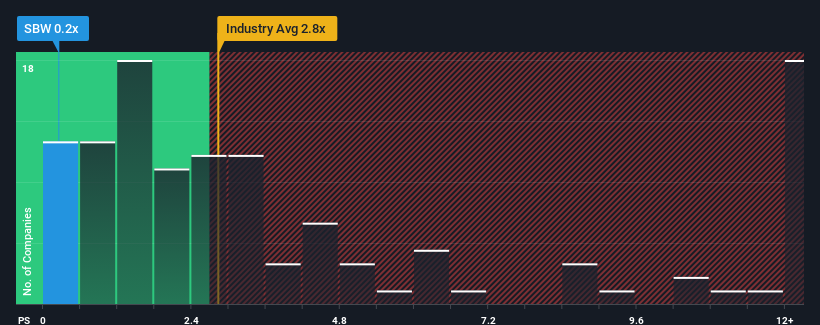
In spite of the firm bounce in price, Shekel Brainweigh may still be sending very bullish signals at the moment with its price-to-sales (or "P/S") ratio of 0.2x, since almost half of all companies in the Software industry in Australia have P/S ratios greater than 2.8x and even P/S higher than 7x are not unusual. Nonetheless, we'd need to dig a little deeper to determine if there is a rational basis for the highly reduced P/S.
See our latest analysis for Shekel Brainweigh
How Shekel Brainweigh Has Been Performing
We'd have to say that with no tangible growth over the last year, Shekel Brainweigh's revenue has been unimpressive. Perhaps the market believes the recent lacklustre revenue performance is a sign of future underperformance relative to industry peers, hurting the P/S. Those who are bullish on Shekel Brainweigh will be hoping that this isn't the case, so that they can pick up the stock at a lower valuation.
We don't have analyst forecasts, but you can see how recent trends are setting up the company for the future by checking out our free report on Shekel Brainweigh's earnings, revenue and cash flow.How Is Shekel Brainweigh's Revenue Growth Trending?
The only time you'd be truly comfortable seeing a P/S as depressed as Shekel Brainweigh's is when the company's growth is on track to lag the industry decidedly.
Retrospectively, the last year delivered virtually the same number to the company's top line as the year before. Regardless, revenue has managed to lift by a handy 29% in aggregate from three years ago, thanks to the earlier period of growth. So it appears to us that the company has had a mixed result in terms of growing revenue over that time.
This is in contrast to the rest of the industry, which is expected to grow by 23% over the next year, materially higher than the company's recent medium-term annualised growth rates.
With this in consideration, it's easy to understand why Shekel Brainweigh's P/S falls short of the mark set by its industry peers. Apparently many shareholders weren't comfortable holding on to something they believe will continue to trail the wider industry.
The Final Word
Even after such a strong price move, Shekel Brainweigh's P/S still trails the rest of the industry. Typically, we'd caution against reading too much into price-to-sales ratios when settling on investment decisions, though it can reveal plenty about what other market participants think about the company.
As we suspected, our examination of Shekel Brainweigh revealed its three-year revenue trends are contributing to its low P/S, given they look worse than current industry expectations. Right now shareholders are accepting the low P/S as they concede future revenue probably won't provide any pleasant surprises. Unless the recent medium-term conditions improve, they will continue to form a barrier for the share price around these levels.
It's always necessary to consider the ever-present spectre of investment risk. We've identified 5 warning signs with Shekel Brainweigh (at least 4 which are a bit unpleasant), and understanding these should be part of your investment process.
If you're unsure about the strength of Shekel Brainweigh's business, why not explore our interactive list of stocks with solid business fundamentals for some other companies you may have missed.
New: Manage All Your Stock Portfolios in One Place
We've created the ultimate portfolio companion for stock investors, and it's free.
• Connect an unlimited number of Portfolios and see your total in one currency
• Be alerted to new Warning Signs or Risks via email or mobile
• Track the Fair Value of your stocks
Have feedback on this article? Concerned about the content? Get in touch with us directly. Alternatively, email editorial-team (at) simplywallst.com.
This article by Simply Wall St is general in nature. We provide commentary based on historical data and analyst forecasts only using an unbiased methodology and our articles are not intended to be financial advice. It does not constitute a recommendation to buy or sell any stock, and does not take account of your objectives, or your financial situation. We aim to bring you long-term focused analysis driven by fundamental data. Note that our analysis may not factor in the latest price-sensitive company announcements or qualitative material. Simply Wall St has no position in any stocks mentioned.
About ASX:SBW
Shekel Brainweigh
Operates as a digital weighing technology company in Israel, Europe, the United States, and internationally.
Moderate and slightly overvalued.
Similar Companies
Market Insights

Advertisement
Community Narratives
The company that turned a verb into a global necessity and basically runs the modern internet, digital ads, smartphones, maps, and AI.
Fair Value US$300.00|5.4% undervalued
OS
Community Contributor
Flowers Foods Pays A Fair Price For Health
Fair Value US$16.12|26.3% undervalued
NV
Community Contributor
TMX Group will thrive with 33.3% profit margin and enduring market moat
Fair Value CA$49.90|4.1% overvalued
LI
Community Contributor
The "Molecular Pencil": Why Beam's Technology is Built to Win
Fair Value US$65.01|62.7% undervalued
DA
Community Contributor