
Advertisement
We can readily understand why investors are attracted to unprofitable companies. For example, although Amazon.com made losses for many years after listing, if you had bought and held the shares since 1999, you would have made a fortune. But while the successes are well known, investors should not ignore the very many unprofitable companies that simply burn through all their cash and collapse.
So, the natural question for Appen (ASX:APX) shareholders is whether they should be concerned by its rate of cash burn. For the purposes of this article, cash burn is the annual rate at which an unprofitable company spends cash to fund its growth; its negative free cash flow. We'll start by comparing its cash burn with its cash reserves in order to calculate its cash runway.
Check out our latest analysis for Appen
Does Appen Have A Long Cash Runway?
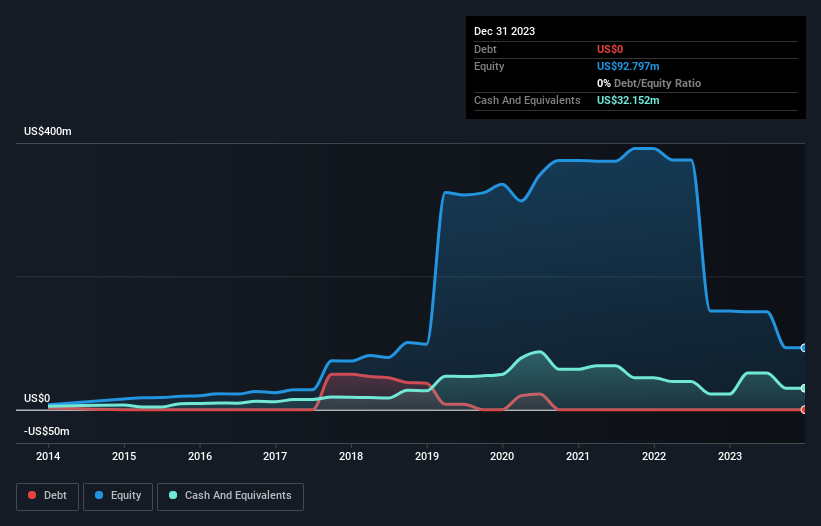
A company's cash runway is the amount of time it would take to burn through its cash reserves at its current cash burn rate. In December 2023, Appen had US$32m in cash, and was debt-free. Importantly, its cash burn was US$43m over the trailing twelve months. So it had a cash runway of approximately 9 months from December 2023. Notably, analysts forecast that Appen will break even (at a free cash flow level) in about 3 years. That means unless the company reduces its cash burn quickly, it may well look to raise more cash. The image below shows how its cash balance has been changing over the last few years.
How Well Is Appen Growing?
It was quite stunning to see that Appen increased its cash burn by 341% over the last year. While that's concerning on it's own, the fact that operating revenue was actually down 30% over the same period makes us positively tremulous. Considering these two factors together makes us nervous about the direction the company seems to be heading. Clearly, however, the crucial factor is whether the company will grow its business going forward. So you might want to take a peek at how much the company is expected to grow in the next few years.
How Hard Would It Be For Appen To Raise More Cash For Growth?
Since Appen can't yet boast improving growth metrics, the market will likely be considering how it can raise more cash if need be. Generally speaking, a listed business can raise new cash through issuing shares or taking on debt. One of the main advantages held by publicly listed companies is that they can sell shares to investors to raise cash and fund growth. By looking at a company's cash burn relative to its market capitalisation, we gain insight on how much shareholders would be diluted if the company needed to raise enough cash to cover another year's cash burn.
Since it has a market capitalisation of US$95m, Appen's US$43m in cash burn equates to about 45% of its market value. From this perspective, it seems that the company spent a huge amount relative to its market value, and we'd be very wary of a painful capital raising.
So, Should We Worry About Appen's Cash Burn?
Appen is not in a great position when it comes to its cash burn situation. Although we can understand if some shareholders find its cash runway acceptable, we can't ignore the fact that we consider its increasing cash burn to be downright troublesome. Shareholders can take heart from the fact that analysts are forecasting it will reach breakeven. After considering the data discussed in this article, we don't have a lot of confidence that its cash burn rate is prudent, as it seems like it might need more cash soon. Taking a deeper dive, we've spotted 5 warning signs for Appen you should be aware of, and 2 of them shouldn't be ignored.
Of course Appen may not be the best stock to buy. So you may wish to see this free collection of companies boasting high return on equity, or this list of stocks that insiders are buying.
New: Manage All Your Stock Portfolios in One Place
We've created the ultimate portfolio companion for stock investors, and it's free.
• Connect an unlimited number of Portfolios and see your total in one currency
• Be alerted to new Warning Signs or Risks via email or mobile
• Track the Fair Value of your stocks
Have feedback on this article? Concerned about the content? Get in touch with us directly. Alternatively, email editorial-team (at) simplywallst.com.
This article by Simply Wall St is general in nature. We provide commentary based on historical data and analyst forecasts only using an unbiased methodology and our articles are not intended to be financial advice. It does not constitute a recommendation to buy or sell any stock, and does not take account of your objectives, or your financial situation. We aim to bring you long-term focused analysis driven by fundamental data. Note that our analysis may not factor in the latest price-sensitive company announcements or qualitative material. Simply Wall St has no position in any stocks mentioned.
About ASX:APX
Appen
Operates as an AI lifecycle company that provides data sourcing, data annotation, and model evaluation solutions in Australia, the United States, and internationally.
Undervalued with excellent balance sheet.
Similar Companies
Market Insights

Advertisement
Community Narratives
MINISO's fair value is projected at 26.69 with an anticipated PE ratio shift of 20x
Fair Value US$24.03|11.0% undervalued
BE
Community Contributor
Procter & Gamble: A Dividend Giant Facing Slowing Growth
Fair Value US$119.81|23.3% overvalued
AN
Community Contributor
Eli Lilly's Future Growth Driven by Tirzepatide and Favorable Market Conditions
Fair Value US$1.19k|13.8% undervalued
EA
Community Contributor