
Advertisement
Legendary fund manager Li Lu (who Charlie Munger backed) once said, 'The biggest investment risk is not the volatility of prices, but whether you will suffer a permanent loss of capital.' So it might be obvious that you need to consider debt, when you think about how risky any given stock is, because too much debt can sink a company. Importantly, Mayne Pharma Group Limited (ASX:MYX) does carry debt. But the more important question is: how much risk is that debt creating?
Why Does Debt Bring Risk?
Generally speaking, debt only becomes a real problem when a company can't easily pay it off, either by raising capital or with its own cash flow. Ultimately, if the company can't fulfill its legal obligations to repay debt, shareholders could walk away with nothing. However, a more common (but still painful) scenario is that it has to raise new equity capital at a low price, thus permanently diluting shareholders. Of course, debt can be an important tool in businesses, particularly capital heavy businesses. The first thing to do when considering how much debt a business uses is to look at its cash and debt together.
View our latest analysis for Mayne Pharma Group
What Is Mayne Pharma Group's Debt?
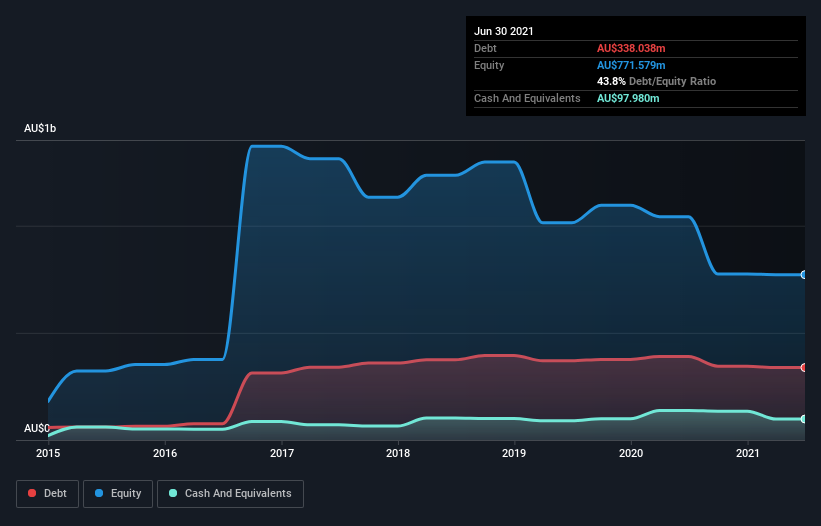
You can click the graphic below for the historical numbers, but it shows that Mayne Pharma Group had AU$338.0m of debt in June 2021, down from AU$389.1m, one year before. However, because it has a cash reserve of AU$98.0m, its net debt is less, at about AU$240.1m.
How Strong Is Mayne Pharma Group's Balance Sheet?
According to the last reported balance sheet, Mayne Pharma Group had liabilities of AU$222.5m due within 12 months, and liabilities of AU$469.1m due beyond 12 months. On the other hand, it had cash of AU$98.0m and AU$193.3m worth of receivables due within a year. So its liabilities total AU$400.3m more than the combination of its cash and short-term receivables.
This is a mountain of leverage relative to its market capitalization of AU$538.3m. This suggests shareholders would be heavily diluted if the company needed to shore up its balance sheet in a hurry. There's no doubt that we learn most about debt from the balance sheet. But it is future earnings, more than anything, that will determine Mayne Pharma Group's ability to maintain a healthy balance sheet going forward. So if you're focused on the future you can check out this free report showing analyst profit forecasts.
In the last year Mayne Pharma Group had a loss before interest and tax, and actually shrunk its revenue by 12%, to AU$401m. That's not what we would hope to see.
Caveat Emptor
While Mayne Pharma Group's falling revenue is about as heartwarming as a wet blanket, arguably its earnings before interest and tax (EBIT) loss is even less appealing. To be specific the EBIT loss came in at AU$12m. When we look at that and recall the liabilities on its balance sheet, relative to cash, it seems unwise to us for the company to have any debt. Quite frankly we think the balance sheet is far from match-fit, although it could be improved with time. We would feel better if it turned its trailing twelve month loss of AU$208m into a profit. In the meantime, we consider the stock very risky. There's no doubt that we learn most about debt from the balance sheet. However, not all investment risk resides within the balance sheet - far from it. For example - Mayne Pharma Group has 1 warning sign we think you should be aware of.
At the end of the day, it's often better to focus on companies that are free from net debt. You can access our special list of such companies (all with a track record of profit growth). It's free.
New: Manage All Your Stock Portfolios in One Place
We've created the ultimate portfolio companion for stock investors, and it's free.
• Connect an unlimited number of Portfolios and see your total in one currency
• Be alerted to new Warning Signs or Risks via email or mobile
• Track the Fair Value of your stocks
This article by Simply Wall St is general in nature. We provide commentary based on historical data and analyst forecasts only using an unbiased methodology and our articles are not intended to be financial advice. It does not constitute a recommendation to buy or sell any stock, and does not take account of your objectives, or your financial situation. We aim to bring you long-term focused analysis driven by fundamental data. Note that our analysis may not factor in the latest price-sensitive company announcements or qualitative material. Simply Wall St has no position in any stocks mentioned.
Have feedback on this article? Concerned about the content? Get in touch with us directly. Alternatively, email editorial-team (at) simplywallst.com.
About ASX:MYX
Mayne Pharma Group
A specialty pharmaceutical company, focuses on the commercialization of women’s health and dermatology pharmaceuticals in Australia, New Zealand, the United States, Canada, Europe, Asia, and internationally.
Excellent balance sheet and slightly overvalued.
Similar Companies
Market Insights

Advertisement
Community Narratives
MINISO's fair value is projected at 26.69 with an anticipated PE ratio shift of 20x
Fair Value US$24.03|12.0% undervalued
BE
Community Contributor
Procter & Gamble: A Dividend Giant Facing Slowing Growth
Fair Value US$119.81|21.7% overvalued
AN
Community Contributor
Eli Lilly's Future Growth Driven by Tirzepatide and Favorable Market Conditions
Fair Value US$1.19k|14.1% undervalued
EA
Community Contributor