

Over the last 7 days, the Australian market has remained flat, yet it has seen an impressive rise of 18% over the past 12 months, with earnings forecasted to grow by 12% annually. In this context of steady growth and positive earnings outlooks, identifying high growth tech stocks can be pivotal for investors seeking opportunities in a dynamic sector that thrives on innovation and scalability.
Top 10 High Growth Tech Companies In Australia
| Name | Revenue Growth | Earnings Growth | Growth Rating |
|---|---|---|---|
| Clinuvel Pharmaceuticals | 22.32% | 27.42% | ★★★★★★ |
| Adherium | 86.80% | 73.66% | ★★★★★★ |
| ImExHS | 20.47% | 111.20% | ★★★★★★ |
| Telix Pharmaceuticals | 20.10% | 38.31% | ★★★★★★ |
| AVA Risk Group | 32.56% | 118.83% | ★★★★★★ |
| Pointerra | 56.62% | 126.45% | ★★★★★★ |
| Careteq | 37.17% | 126.21% | ★★★★★☆ |
| Wrkr | 36.31% | 100.29% | ★★★★★★ |
| Adveritas | 57.98% | 144.21% | ★★★★★★ |
| SiteMinder | 19.40% | 60.64% | ★★★★★☆ |
Click here to see the full list of 64 stocks from our ASX High Growth Tech and AI Stocks screener.
Below we spotlight a couple of our favorites from our exclusive screener.
FINEOS Corporation Holdings (ASX:FCL)
Simply Wall St Growth Rating: ★★★★☆☆
Overview: FINEOS Corporation Holdings plc develops and sells enterprise claims and policy management software for the employee benefits and life, accident, and health insurance industries globally, with a market capitalization of A$468.57 million.
Operations: FINEOS Corporation Holdings generates revenue primarily from its software and programming segment, amounting to €122.24 million. The company focuses on providing specialized software solutions for claims and policy management in the insurance sector.
FINEOS Corporation Holdings, despite recent challenges including being dropped from the S&P Global BMI Index, continues to show promise in the tech sector with a forecasted annual earnings growth of 71.9%. The company's commitment to innovation is evident in its R&D expenses, which are crucial for staying competitive. Notably, FINEOS has reaffirmed its revenue guidance for fiscal year 2024 between EUR 130 million and EUR 135 million. This stability is supported by strategic client acquisitions like Voya Financial for their integrated disability management platform, set to launch in 2025. These developments suggest a resilient adaptation strategy amidst market fluctuations and an ongoing investment in technology that could shape its future trajectory in high-growth sectors.

Mesoblast (ASX:MSB)
Simply Wall St Growth Rating: ★★★★★☆
Overview: Mesoblast Limited focuses on developing regenerative medicine products across Australia, the United States, Singapore, and Switzerland with a market capitalization of A$1.67 billion.
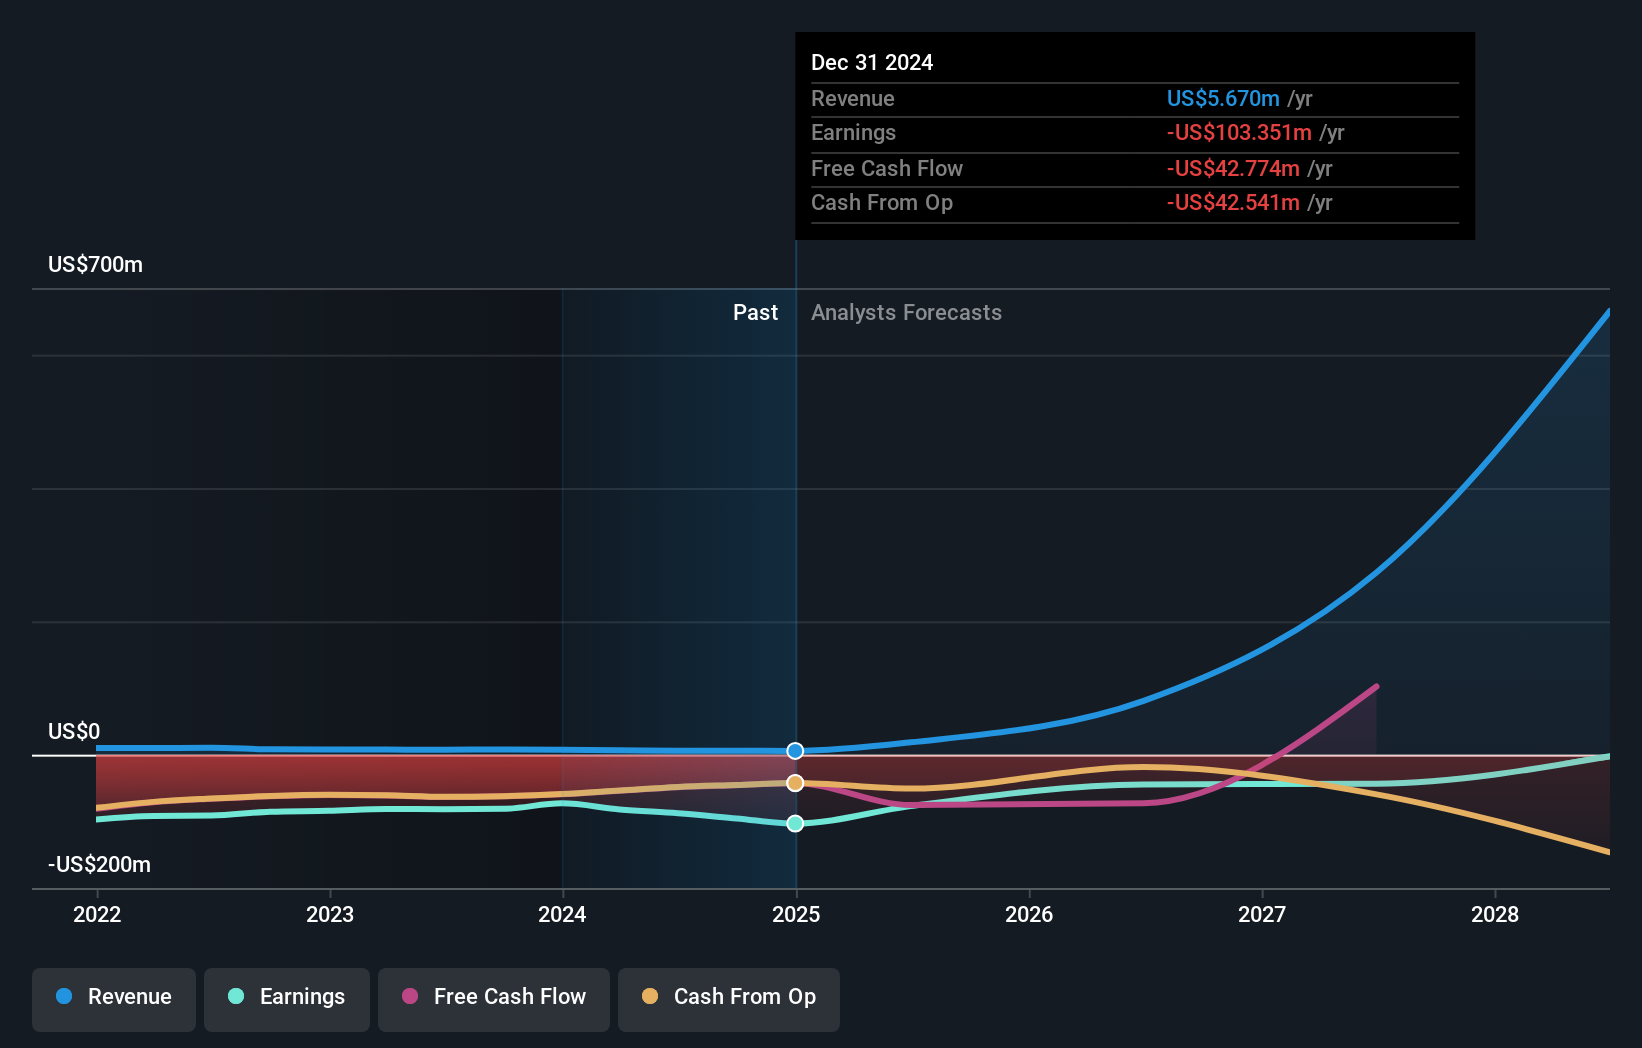
Operations: Mesoblast generates revenue primarily from the commercialization of its cell technology platform, amounting to $5.90 million. The company's focus on regenerative medicine spans multiple countries, including Australia, the United States, Singapore, and Switzerland.
Mesoblast's recent strategic moves, including a significant private placement of AUD 72.7 million and FDA advancements for its Ryoncil treatment, underscore its potential in the biotech sector. Despite being dropped from the S&P/ASX Emerging Companies Index and facing a net loss reduction to USD 87.96 million from USD 81.89 million year-over-year, Mesoblast is poised for recovery with projected revenue growth at an impressive rate of 45.8% annually. The company's focus on high-stakes medical treatments reflects a bold approach to addressing unmet medical needs, potentially setting it up for substantial future gains as it moves towards profitability with an expected annual profit growth rate of 60.82%.
REA Group (ASX:REA)
Simply Wall St Growth Rating: ★★★★☆☆
Overview: REA Group Limited operates an online property advertising business across Australia, India, the United States, Malaysia, Singapore, Thailand, Vietnam, and other international markets with a market cap of A$27.98 billion.
Operations: The group generates revenue primarily from its property and online advertising segment in Australia, which accounts for A$1.25 billion, followed by financial services at A$320.6 million, and operations in India contributing A$103.1 million. The company's business model is heavily reliant on digital advertising services within the real estate sector across multiple international markets.
REA Group, despite a challenging year with a 15% drop in earnings, has managed to stay ahead of the broader Australian market with its revenue projected to grow at 6.5% annually, outpacing the national average of 5.5%. This resilience is underscored by a robust forecast in earnings growth at an annual rate of 16.8%, signaling potential recovery and expansion in the interactive media and services sector. The company's commitment to innovation is evident from its R&D spending trends which have consistently aligned with strategic growth areas, although specific figures were not disclosed. Additionally, REA's recent decision to increase its dividend by 23% reflects confidence in its financial health and future prospects, further supported by a substantial net income of AUD 302.8 million for the fiscal year ending June 2024. This performance is particularly noteworthy given the significant one-off loss of AUD 153.6 million that impacted their last financial results but did not deter their progressive financial strategies or investment in growth areas like digital real estate services—a sector poised for technological advancements and increased online engagement trends globally.
- Take a closer look at REA Group's potential here in our health report.
Examine REA Group's past performance report to understand how it has performed in the past.

Summing It All Up
- Dive into all 64 of the ASX High Growth Tech and AI Stocks we have identified here.
- Are any of these part of your asset mix? Tap into the analytical power of Simply Wall St's portfolio to get a 360-degree view on how they're shaping up.
- Simply Wall St is a revolutionary app designed for long-term stock investors, it's free and covers every market in the world.
Curious About Other Options?
- Explore high-performing small cap companies that haven't yet garnered significant analyst attention.
- Fuel your portfolio with companies showing strong growth potential, backed by optimistic outlooks both from analysts and management.
- Find companies with promising cash flow potential yet trading below their fair value.
This article by Simply Wall St is general in nature. We provide commentary based on historical data and analyst forecasts only using an unbiased methodology and our articles are not intended to be financial advice. It does not constitute a recommendation to buy or sell any stock, and does not take account of your objectives, or your financial situation. We aim to bring you long-term focused analysis driven by fundamental data. Note that our analysis may not factor in the latest price-sensitive company announcements or qualitative material. Simply Wall St has no position in any stocks mentioned.
New: Manage All Your Stock Portfolios in One Place
We've created the ultimate portfolio companion for stock investors, and it's free.
• Connect an unlimited number of Portfolios and see your total in one currency
• Be alerted to new Warning Signs or Risks via email or mobile
• Track the Fair Value of your stocks
Have feedback on this article? Concerned about the content? Get in touch with us directly. Alternatively, email editorial-team@simplywallst.com
About ASX:MSB
Mesoblast
Engages in the development of regenerative medicine products in Australia, the United States, Singapore, and Switzerland.
High growth potential and good value.

