
Advertisement
- Australia
- /
- Life Sciences
- /
- ASX:GSS
Genetic Signatures Limited (ASX:GSS) Might Not Be As Mispriced As It Looks After Plunging 30%
Unfortunately for some shareholders, the Genetic Signatures Limited (ASX:GSS) share price has dived 30% in the last thirty days, prolonging recent pain. The drop over the last 30 days has capped off a tough year for shareholders, with the share price down 46% in that time.
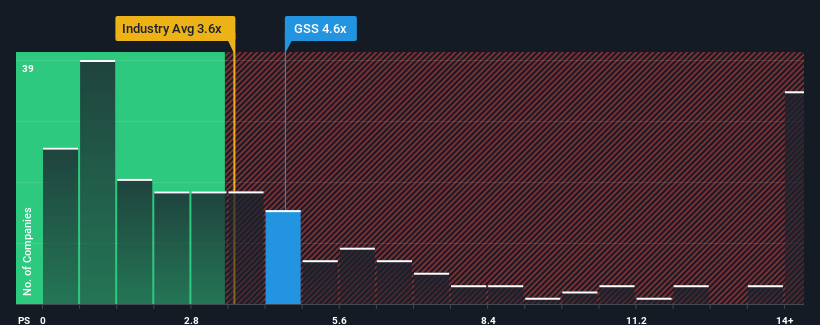
Even after such a large drop in price, you could still be forgiven for feeling indifferent about Genetic Signatures' P/S ratio of 4.6x, since the median price-to-sales (or "P/S") ratio for the Life Sciences industry in Australia is also close to 4x. However, investors might be overlooking a clear opportunity or potential setback if there is no rational basis for the P/S.
See our latest analysis for Genetic Signatures
How Genetic Signatures Has Been Performing
Recent times have been pleasing for Genetic Signatures as its revenue has risen in spite of the industry's average revenue going into reverse. One possibility is that the P/S ratio is moderate because investors think the company's revenue will be less resilient moving forward. Those who are bullish on Genetic Signatures will be hoping that this isn't the case, so that they can pick up the stock at a slightly lower valuation.
Keen to find out how analysts think Genetic Signatures' future stacks up against the industry? In that case, our free report is a great place to start .How Is Genetic Signatures' Revenue Growth Trending?
In order to justify its P/S ratio, Genetic Signatures would need to produce growth that's similar to the industry.
Retrospectively, the last year delivered an exceptional 27% gain to the company's top line. Still, revenue has fallen 40% in total from three years ago, which is quite disappointing. Therefore, it's fair to say the revenue growth recently has been undesirable for the company.
Looking ahead now, revenue is anticipated to climb by 45% during the coming year according to the lone analyst following the company. With the industry only predicted to deliver 9.1%, the company is positioned for a stronger revenue result.
In light of this, it's curious that Genetic Signatures' P/S sits in line with the majority of other companies. Apparently some shareholders are skeptical of the forecasts and have been accepting lower selling prices.
What We Can Learn From Genetic Signatures' P/S?
Following Genetic Signatures' share price tumble, its P/S is just clinging on to the industry median P/S. We'd say the price-to-sales ratio's power isn't primarily as a valuation instrument but rather to gauge current investor sentiment and future expectations.
Looking at Genetic Signatures' analyst forecasts revealed that its superior revenue outlook isn't giving the boost to its P/S that we would've expected. There could be some risks that the market is pricing in, which is preventing the P/S ratio from matching the positive outlook. However, if you agree with the analysts' forecasts, you may be able to pick up the stock at an attractive price.
Having said that, be aware Genetic Signatures is showing 2 warning signs in our investment analysis, you should know about.
If companies with solid past earnings growth is up your alley, you may wish to see this free collection of other companies with strong earnings growth and low P/E ratios.
New: Manage All Your Stock Portfolios in One Place
We've created the ultimate portfolio companion for stock investors, and it's free.
• Connect an unlimited number of Portfolios and see your total in one currency
• Be alerted to new Warning Signs or Risks via email or mobile
• Track the Fair Value of your stocks
Have feedback on this article? Concerned about the content? Get in touch with us directly. Alternatively, email editorial-team (at) simplywallst.com.
This article by Simply Wall St is general in nature. We provide commentary based on historical data and analyst forecasts only using an unbiased methodology and our articles are not intended to be financial advice. It does not constitute a recommendation to buy or sell any stock, and does not take account of your objectives, or your financial situation. We aim to bring you long-term focused analysis driven by fundamental data. Note that our analysis may not factor in the latest price-sensitive company announcements or qualitative material. Simply Wall St has no position in any stocks mentioned.
About ASX:GSS
Genetic Signatures
Operates as a molecular diagnostic company in Australia, the Asia Pacific, Europe, the Middle East, Asia, and the Americas.
Flawless balance sheet and fair value.
Similar Companies
Market Insights

Advertisement
Community Narratives
MINISO's fair value is projected at 26.69 with an anticipated PE ratio shift of 20x
Fair Value US$24.03|9.0% undervalued
BE
Community Contributor
Procter & Gamble: A Dividend Giant Facing Slowing Growth
Fair Value US$119.81|23.5% overvalued
AN
Community Contributor
Eli Lilly's Future Growth Driven by Tirzepatide and Favorable Market Conditions
Fair Value US$1.19k|14.4% undervalued
EA
Community Contributor