
Advertisement
Australian shares are poised for a rebound, with futures indicating a positive open as local investors take cues from Wall Street's recent gains. For those interested in exploring smaller or newer companies, penny stocks—despite their somewhat dated terminology—continue to offer intriguing opportunities. By focusing on firms with solid financial foundations and potential for growth, investors may uncover valuable prospects within the realm of penny stocks.
Top 10 Penny Stocks In Australia
| Name | Share Price | Market Cap | Rewards & Risks |
| Alfabs Australia (ASX:AAL) | A$0.48 | A$137.56M | ✅ 4 ⚠️ 3 View Analysis > |
| Dusk Group (ASX:DSK) | A$0.895 | A$55.73M | ✅ 4 ⚠️ 2 View Analysis > |
| IVE Group (ASX:IGL) | A$2.95 | A$453.39M | ✅ 4 ⚠️ 3 View Analysis > |
| MotorCycle Holdings (ASX:MTO) | A$3.61 | A$266.44M | ✅ 4 ⚠️ 2 View Analysis > |
| Pureprofile (ASX:PPL) | A$0.043 | A$50.3M | ✅ 3 ⚠️ 1 View Analysis > |
| West African Resources (ASX:WAF) | A$3.04 | A$3.47B | ✅ 4 ⚠️ 2 View Analysis > |
| Service Stream (ASX:SSM) | A$2.19 | A$1.34B | ✅ 3 ⚠️ 1 View Analysis > |
| Fleetwood (ASX:FWD) | A$2.89 | A$267.56M | ✅ 3 ⚠️ 2 View Analysis > |
| Perenti (ASX:PRN) | A$2.56 | A$2.41B | ✅ 3 ⚠️ 3 View Analysis > |
| GWA Group (ASX:GWA) | A$2.34 | A$614.87M | ✅ 5 ⚠️ 1 View Analysis > |
Click here to see the full list of 419 stocks from our ASX Penny Stocks screener.
Let's take a closer look at a couple of our picks from the screened companies.
3P Learning (ASX:3PL)
Simply Wall St Financial Health Rating: ★★★★★☆
Overview: 3P Learning Limited develops, markets, and sells educational software and e-books to schools and parents globally, with a market cap of A$170.57 million.
Operations: The company's revenue is derived from two primary segments: Business-To-School ('B2B') generating A$65.63 million and Business-To-Consumer ('B2C') contributing A$43.45 million.
Market Cap: A$170.57M
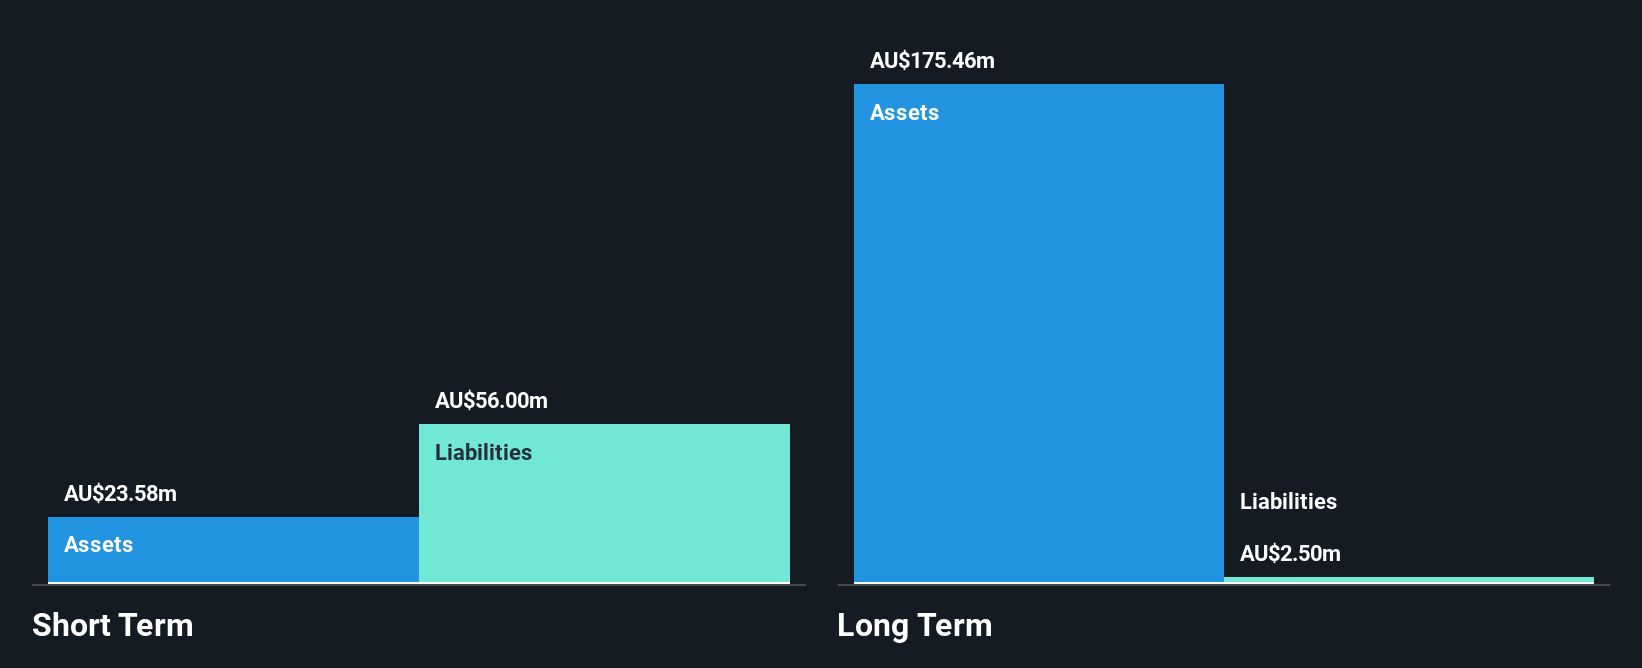
3P Learning Limited recently reported a slight decline in revenue to A$109.08 million for the year ended June 30, 2025, with net income of A$0.21 million, marking a turnaround from the previous year's loss. Despite trading significantly below its estimated fair value and being debt-free, the company's short-term assets do not cover its short-term liabilities of A$56 million. The management team and board are experienced, with average tenures of 3.8 and 4.3 years respectively. Earnings growth is forecast at an impressive rate; however, past performance has been impacted by large one-off items affecting financial results.
- Unlock comprehensive insights into our analysis of 3P Learning stock in this financial health report.
- Examine 3P Learning's earnings growth report to understand how analysts expect it to perform.
RAS Technology Holdings (ASX:RTH)
Simply Wall St Financial Health Rating: ★★★★★★
Overview: RAS Technology Holdings Limited offers data, content, SaaS solutions, and digital and media services across Australia, the UK, the US, Asia, and other international markets with a market cap of A$58.64 million.
Operations: The company generates revenue from its Entertainment Software segment, amounting to A$21.27 million.
Market Cap: A$58.64M
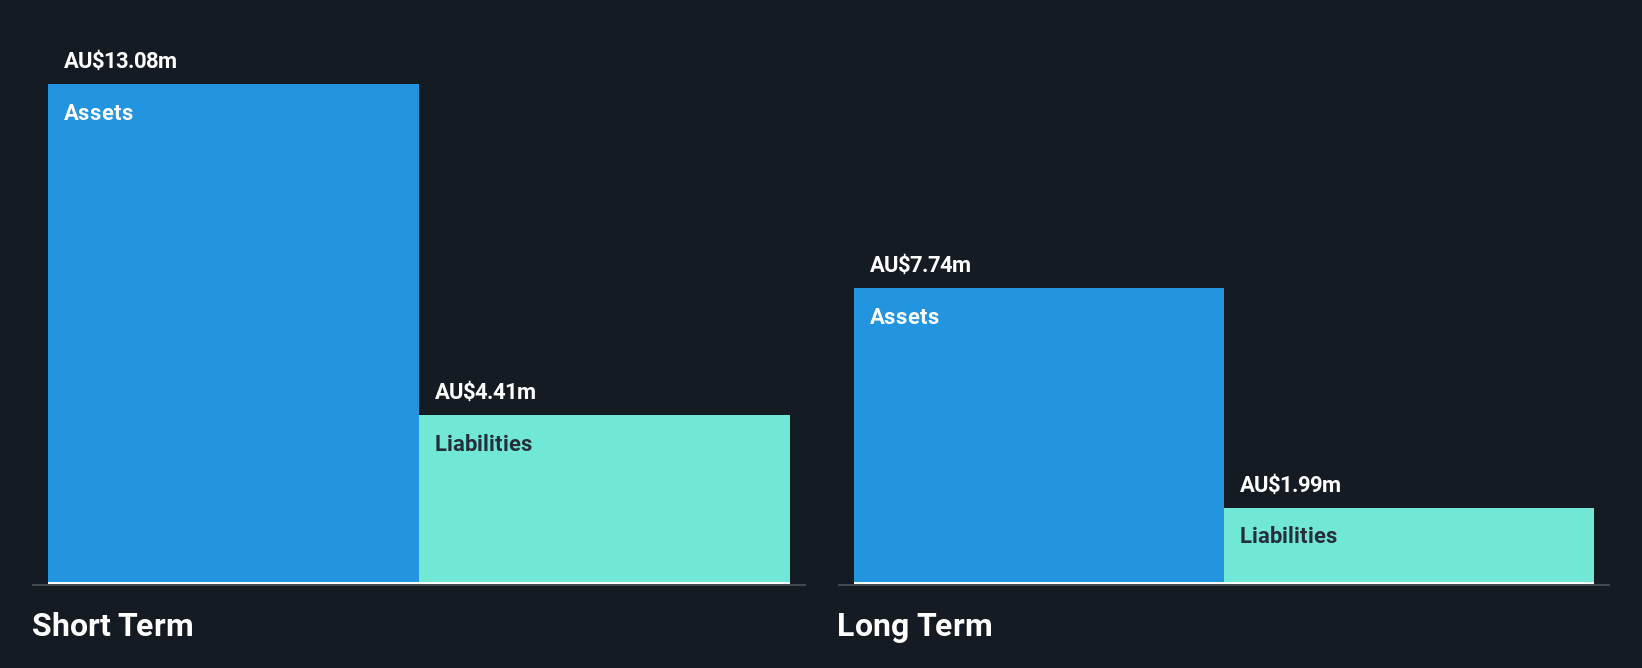
RAS Technology Holdings Limited has demonstrated a positive shift by becoming profitable in the last year, with net income reaching A$0.53 million compared to a previous loss. The company reported revenue of A$21.27 million for the fiscal year ended June 30, 2025, indicating growth from the prior year. RAS Technology is debt-free and its short-term assets comfortably exceed both short and long-term liabilities, providing financial stability. Despite low return on equity at 3.6%, it trades significantly below its estimated fair value. The management team and board are experienced, contributing to operational consistency amidst stable weekly volatility.
- Click to explore a detailed breakdown of our findings in RAS Technology Holdings' financial health report.
- Review our growth performance report to gain insights into RAS Technology Holdings' future.
Tinybeans Group (ASX:TNY)
Simply Wall St Financial Health Rating: ★★★★★★
Overview: Tinybeans Group Limited operates a consumer subscription platform catering to parents and families in the United States, Australia, and internationally, with a market cap of A$20.71 million.
Operations: The company generates revenue of $4.82 million from its Internet Software & Services segment.
Market Cap: A$20.71M
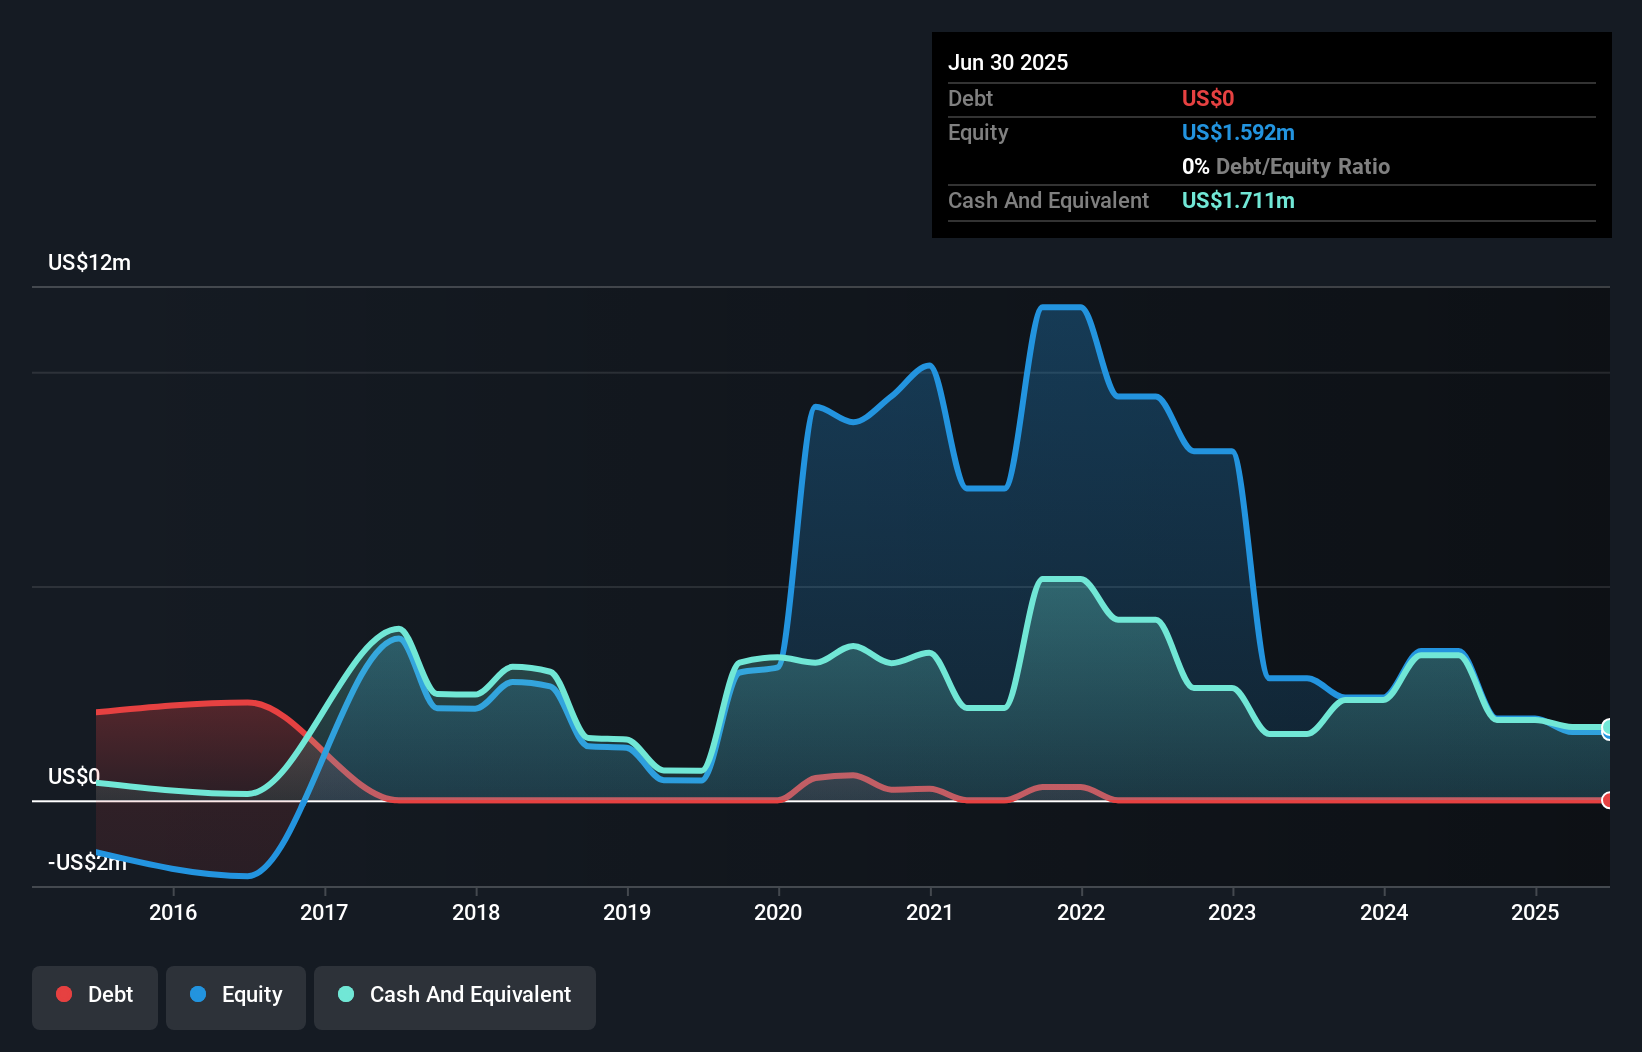
Tinybeans Group Limited, with a market cap of A$20.71 million, operates in the Internet Software & Services sector but lacks meaningful revenue, reporting US$0.23 million for the year ended June 30, 2025. The company remains unprofitable with a net loss of US$2.27 million despite reducing its losses from the previous year. It is debt-free and has sufficient cash runway for over a year based on current free cash flow trends. Recent strategic moves include entering into an agreement to acquire assets from Qeepsake Inc., which may influence future growth prospects amidst its undervaluation compared to fair value estimates.
- Click here to discover the nuances of Tinybeans Group with our detailed analytical financial health report.
- Explore historical data to track Tinybeans Group's performance over time in our past results report.
Make It Happen
- Take a closer look at our ASX Penny Stocks list of 419 companies by clicking here.
- Interested In Other Possibilities? This technology could replace computers: discover the 27 stocks are working to make quantum computing a reality.
This article by Simply Wall St is general in nature. We provide commentary based on historical data and analyst forecasts only using an unbiased methodology and our articles are not intended to be financial advice. It does not constitute a recommendation to buy or sell any stock, and does not take account of your objectives, or your financial situation. We aim to bring you long-term focused analysis driven by fundamental data. Note that our analysis may not factor in the latest price-sensitive company announcements or qualitative material. Simply Wall St has no position in any stocks mentioned.
Valuation is complex, but we're here to simplify it.
Discover if Tinybeans Group might be undervalued or overvalued with our detailed analysis, featuring fair value estimates, potential risks, dividends, insider trades, and its financial condition.
Access Free AnalysisHave feedback on this article? Concerned about the content? Get in touch with us directly. Alternatively, email editorial-team@simplywallst.com
About ASX:TNY
Tinybeans Group
Operates a consumer subscription platform for parents and families in the United States, Australia, and internationally.
Flawless balance sheet with slight risk.
Similar Companies
Market Insights

Advertisement
Community Narratives
The company that turned a verb into a global necessity and basically runs the modern internet, digital ads, smartphones, maps, and AI.
Fair Value US$300.00|5.2% undervalued
OS
Community Contributor
Flowers Foods Pays A Fair Price For Health
Fair Value US$16.12|24.9% undervalued
NV
Community Contributor
TMX Group will thrive with 33.3% profit margin and enduring market moat
Fair Value CA$49.90|3.3% overvalued
LI
Community Contributor
The "Molecular Pencil": Why Beam's Technology is Built to Win
Fair Value US$65.01|64.5% undervalued
DA
Community Contributor