
Advertisement
Calculating The Intrinsic Value Of CAR Group Limited (ASX:CAR)

Key Insights
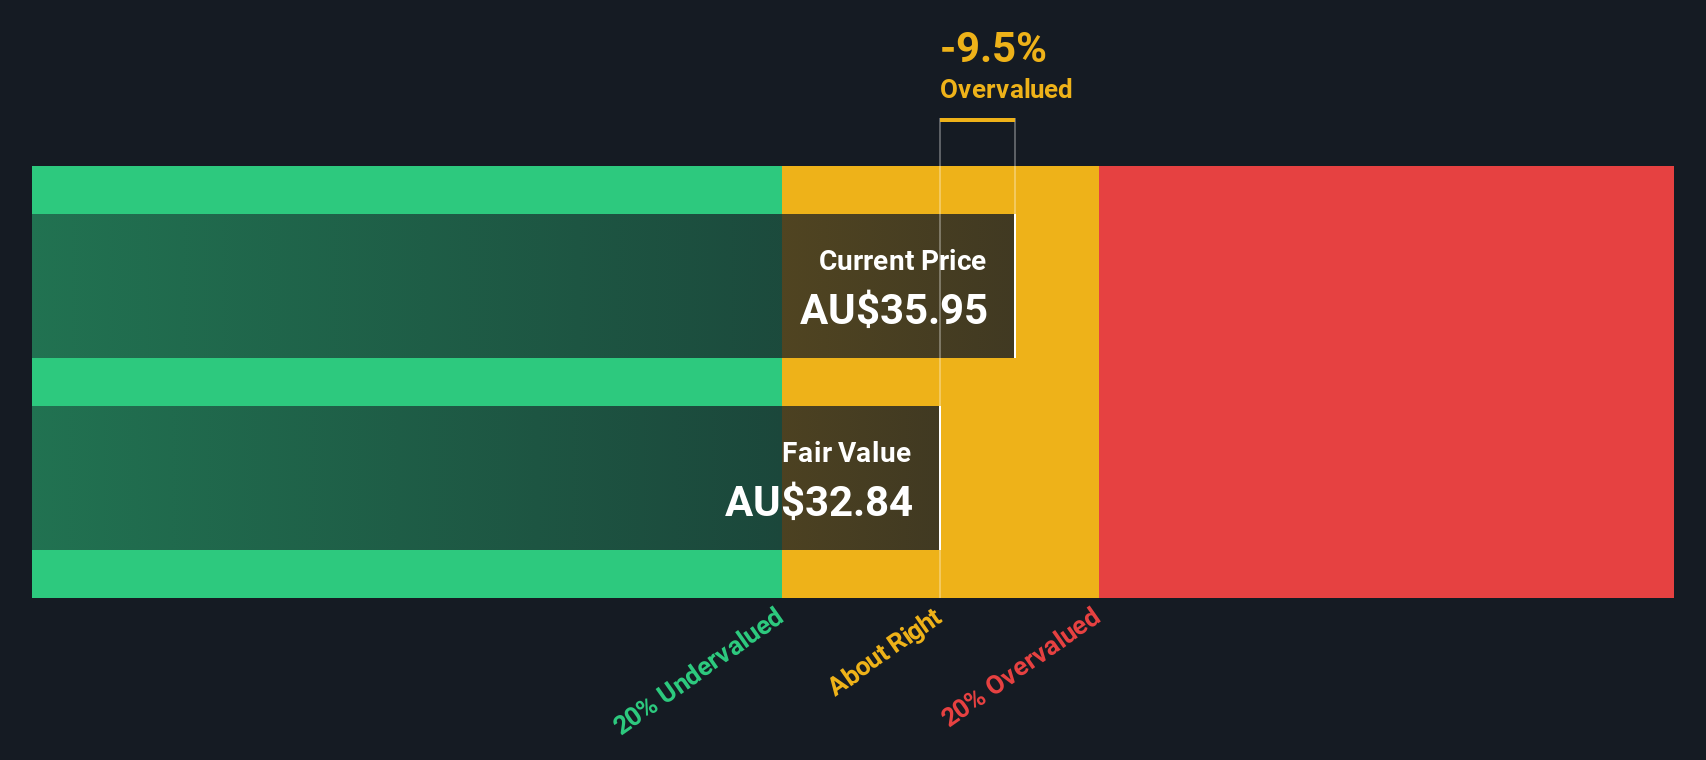
- Using the 2 Stage Free Cash Flow to Equity, CAR Group fair value estimate is AU$32.84
- CAR Group's AU$35.95 share price indicates it is trading at similar levels as its fair value estimate
- The AU$39.20 analyst price target for CAR is 19% more than our estimate of fair value
In this article we are going to estimate the intrinsic value of CAR Group Limited (ASX:CAR) by taking the expected future cash flows and discounting them to today's value. This will be done using the Discounted Cash Flow (DCF) model. It may sound complicated, but actually it is quite simple!
We would caution that there are many ways of valuing a company and, like the DCF, each technique has advantages and disadvantages in certain scenarios. If you want to learn more about discounted cash flow, the rationale behind this calculation can be read in detail in the Simply Wall St analysis model.
The Model
We are going to use a two-stage DCF model, which, as the name states, takes into account two stages of growth. The first stage is generally a higher growth period which levels off heading towards the terminal value, captured in the second 'steady growth' period. In the first stage we need to estimate the cash flows to the business over the next ten years. Where possible we use analyst estimates, but when these aren't available we extrapolate the previous free cash flow (FCF) from the last estimate or reported value. We assume companies with shrinking free cash flow will slow their rate of shrinkage, and that companies with growing free cash flow will see their growth rate slow, over this period. We do this to reflect that growth tends to slow more in the early years than it does in later years.
A DCF is all about the idea that a dollar in the future is less valuable than a dollar today, so we discount the value of these future cash flows to their estimated value in today's dollars:
10-year free cash flow (FCF) estimate
| 2025 | 2026 | 2027 | 2028 | 2029 | 2030 | 2031 | 2032 | 2033 | 2034 | |
| Levered FCF (A$, Millions) | AU$379.3m | AU$442.8m | AU$495.1m | AU$580.4m | AU$639.0m | AU$684.2m | AU$724.2m | AU$760.2m | AU$793.3m | AU$824.6m |
| Growth Rate Estimate Source | Analyst x7 | Analyst x7 | Analyst x7 | Analyst x2 | Analyst x1 | Est @ 7.08% | Est @ 5.84% | Est @ 4.97% | Est @ 4.37% | Est @ 3.94% |
| Present Value (A$, Millions) Discounted @ 7.8% | AU$352 | AU$381 | AU$396 | AU$430 | AU$440 | AU$437 | AU$429 | AU$418 | AU$405 | AU$390 |
("Est" = FCF growth rate estimated by Simply Wall St)
Present Value of 10-year Cash Flow (PVCF) = AU$4.1b
The second stage is also known as Terminal Value, this is the business's cash flow after the first stage. For a number of reasons a very conservative growth rate is used that cannot exceed that of a country's GDP growth. In this case we have used the 5-year average of the 10-year government bond yield (2.9%) to estimate future growth. In the same way as with the 10-year 'growth' period, we discount future cash flows to today's value, using a cost of equity of 7.8%.
Terminal Value (TV)= FCF2034 × (1 + g) ÷ (r – g) = AU$825m× (1 + 2.9%) ÷ (7.8%– 2.9%) = AU$18b
Present Value of Terminal Value (PVTV)= TV / (1 + r)10= AU$18b÷ ( 1 + 7.8%)10= AU$8.3b
The total value, or equity value, is then the sum of the present value of the future cash flows, which in this case is AU$12b. In the final step we divide the equity value by the number of shares outstanding. Compared to the current share price of AU$36.0, the company appears around fair value at the time of writing. Valuations are imprecise instruments though, rather like a telescope - move a few degrees and end up in a different galaxy. Do keep this in mind.
Important Assumptions
The calculation above is very dependent on two assumptions. The first is the discount rate and the other is the cash flows. You don't have to agree with these inputs, I recommend redoing the calculations yourself and playing with them. The DCF also does not consider the possible cyclicality of an industry, or a company's future capital requirements, so it does not give a full picture of a company's potential performance. Given that we are looking at CAR Group as potential shareholders, the cost of equity is used as the discount rate, rather than the cost of capital (or weighted average cost of capital, WACC) which accounts for debt. In this calculation we've used 7.8%, which is based on a levered beta of 1.113. Beta is a measure of a stock's volatility, compared to the market as a whole. We get our beta from the industry average beta of globally comparable companies, with an imposed limit between 0.8 and 2.0, which is a reasonable range for a stable business.
See our latest analysis for CAR Group
SWOT Analysis for CAR Group
Strength
- Debt is not viewed as a risk.
Weakness
- Earnings declined over the past year.
- Dividend is low compared to the top 25% of dividend payers in the Interactive Media and Services market.
- Expensive based on P/E ratio and estimated fair value.
Opportunity
- Annual earnings are forecast to grow faster than the Australian market.
Threat
- Dividends are not covered by earnings.
- Revenue is forecast to grow slower than 20% per year.
Moving On:
Valuation is only one side of the coin in terms of building your investment thesis, and it shouldn't be the only metric you look at when researching a company. DCF models are not the be-all and end-all of investment valuation. Instead the best use for a DCF model is to test certain assumptions and theories to see if they would lead to the company being undervalued or overvalued. For instance, if the terminal value growth rate is adjusted slightly, it can dramatically alter the overall result. For CAR Group, we've put together three further factors you should explore:
- Risks: You should be aware of the 1 warning sign for CAR Group we've uncovered before considering an investment in the company.
- Future Earnings: How does CAR's growth rate compare to its peers and the wider market? Dig deeper into the analyst consensus number for the upcoming years by interacting with our free analyst growth expectation chart.
- Other Solid Businesses: Low debt, high returns on equity and good past performance are fundamental to a strong business. Why not explore our interactive list of stocks with solid business fundamentals to see if there are other companies you may not have considered!
PS. Simply Wall St updates its DCF calculation for every Australian stock every day, so if you want to find the intrinsic value of any other stock just search here.
New: AI Stock Screener & Alerts
Our new AI Stock Screener scans the market every day to uncover opportunities.
• Dividend Powerhouses (3%+ Yield)
• Undervalued Small Caps with Insider Buying
• High growth Tech and AI Companies
Or build your own from over 50 metrics.
Have feedback on this article? Concerned about the content? Get in touch with us directly. Alternatively, email editorial-team (at) simplywallst.com.
This article by Simply Wall St is general in nature. We provide commentary based on historical data and analyst forecasts only using an unbiased methodology and our articles are not intended to be financial advice. It does not constitute a recommendation to buy or sell any stock, and does not take account of your objectives, or your financial situation. We aim to bring you long-term focused analysis driven by fundamental data. Note that our analysis may not factor in the latest price-sensitive company announcements or qualitative material. Simply Wall St has no position in any stocks mentioned.
About ASX:CAR
CAR Group
Engages in the operation of online automotive, motorcycle, and marine classifieds business in Australia, New Zealand, Brazil, South Korea, Malaysia, Indonesia, Thailand, Chile, China, the United States, and Mexico.
Excellent balance sheet with moderate growth potential.
Similar Companies
Market Insights

Advertisement
Community Narratives
The Future of Drug Testing? Fingerprint Tech Shows Serious Promise
Fair Value US$2.98|35.9% undervalued
JO
Community Contributor
Occidental Petroleum is set to achieve a 16% profit margin improvement
Fair Value US$55.05|15.6% undervalued
DZ
Community Contributor
Argan's Revenue Set to Soar with a 13.31% Growth in the Coming Decade
Fair Value US$284.68|23.4% undervalued
KE
Community Contributor
EU#1 - From German Startup to EU’s Biggest Company
Fair Value €248.62|2.5% overvalued
TO
Community Contributor