- Australia
- /
- Metals and Mining
- /
- ASX:SRK
Companies Like Strike Resources (ASX:SRK) Are In A Position To Invest In Growth
There's no doubt that money can be made by owning shares of unprofitable businesses. By way of example, Strike Resources (ASX:SRK) has seen its share price rise 476% over the last year, delighting many shareholders. Having said that, unprofitable companies are risky because they could potentially burn through all their cash and become distressed.
So notwithstanding the buoyant share price, we think it's well worth asking whether Strike Resources' cash burn is too risky. For the purpose of this article, we'll define cash burn as the amount of cash the company is spending each year to fund its growth (also called its negative free cash flow). The first step is to compare its cash burn with its cash reserves, to give us its 'cash runway'.
View our latest analysis for Strike Resources
Does Strike Resources Have A Long Cash Runway?
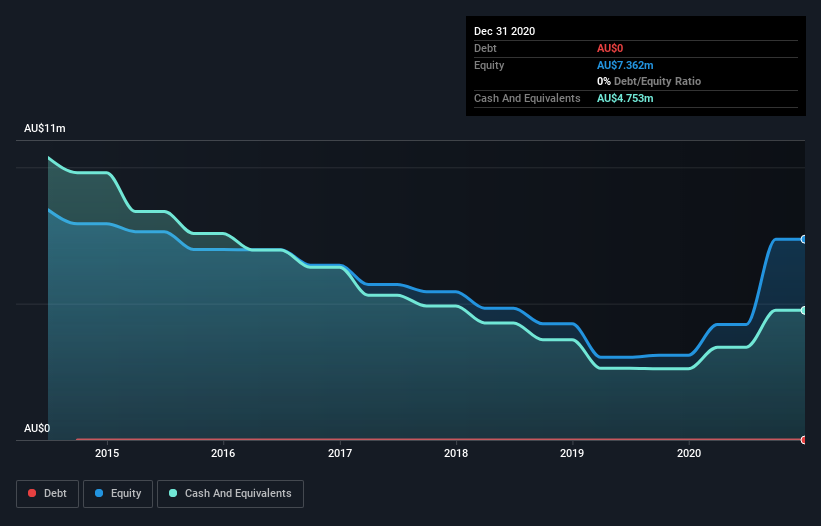
A company's cash runway is calculated by dividing its cash hoard by its cash burn. As at December 2020, Strike Resources had cash of AU$4.8m and no debt. Looking at the last year, the company burnt through AU$2.9m. Therefore, from December 2020 it had roughly 19 months of cash runway. That's not too bad, but it's fair to say the end of the cash runway is in sight, unless cash burn reduces drastically. Depicted below, you can see how its cash holdings have changed over time.

How Is Strike Resources' Cash Burn Changing Over Time?
While Strike Resources did record statutory revenue of AU$100k over the last year, it didn't have any revenue from operations. To us, that makes it a pre-revenue company, so we'll look to its cash burn trajectory as an assessment of its cash burn situation. With the cash burn rate up 29% in the last year, it seems that the company is ratcheting up investment in the business over time. However, the company's true cash runway will therefore be shorter than suggested above, if spending continues to increase. Strike Resources makes us a little nervous due to its lack of substantial operating revenue. We prefer most of the stocks on this list of stocks that analysts expect to grow.
How Hard Would It Be For Strike Resources To Raise More Cash For Growth?
Given its cash burn trajectory, Strike Resources shareholders may wish to consider how easily it could raise more cash, despite its solid cash runway. Companies can raise capital through either debt or equity. Many companies end up issuing new shares to fund future growth. By looking at a company's cash burn relative to its market capitalisation, we gain insight on how much shareholders would be diluted if the company needed to raise enough cash to cover another year's cash burn.
Strike Resources' cash burn of AU$2.9m is about 4.4% of its AU$67m market capitalisation. Given that is a rather small percentage, it would probably be really easy for the company to fund another year's growth by issuing some new shares to investors, or even by taking out a loan.
So, Should We Worry About Strike Resources' Cash Burn?
On this analysis of Strike Resources' cash burn, we think its cash burn relative to its market cap was reassuring, while its increasing cash burn has us a bit worried. While we're the kind of investors who are always a bit concerned about the risks involved with cash burning companies, the metrics we have discussed in this article leave us relatively comfortable about Strike Resources' situation. Separately, we looked at different risks affecting the company and spotted 5 warning signs for Strike Resources (of which 2 make us uncomfortable!) you should know about.
Of course, you might find a fantastic investment by looking elsewhere. So take a peek at this free list of companies insiders are buying, and this list of stocks growth stocks (according to analyst forecasts)
When trading Strike Resources or any other investment, use the platform considered by many to be the Professional's Gateway to the Worlds Market, Interactive Brokers. You get the lowest-cost* trading on stocks, options, futures, forex, bonds and funds worldwide from a single integrated account. Promoted
New: Manage All Your Stock Portfolios in One Place
We've created the ultimate portfolio companion for stock investors, and it's free.
• Connect an unlimited number of Portfolios and see your total in one currency
• Be alerted to new Warning Signs or Risks via email or mobile
• Track the Fair Value of your stocks
This article by Simply Wall St is general in nature. It does not constitute a recommendation to buy or sell any stock, and does not take account of your objectives, or your financial situation. We aim to bring you long-term focused analysis driven by fundamental data. Note that our analysis may not factor in the latest price-sensitive company announcements or qualitative material. Simply Wall St has no position in any stocks mentioned.
*Interactive Brokers Rated Lowest Cost Broker by StockBrokers.com Annual Online Review 2020
Have feedback on this article? Concerned about the content? Get in touch with us directly. Alternatively, email editorial-team (at) simplywallst.com.
About ASX:SRK
Strike Resources
Operates as a mineral exploration company in Australia, Argentina, and Peru.
Flawless balance sheet with slight risk.
Market Insights
Community Narratives


Recently Updated Narratives


MINISO's fair value is projected at 26.69 with an anticipated PE ratio shift of 20x


The Quiet Giant That Became AI’s Power Grid


Nova Ljubljanska Banka d.d will expect a 11.2% revenue boost driving future growth
Popular Narratives


The company that turned a verb into a global necessity and basically runs the modern internet, digital ads, smartphones, maps, and AI.


MicroVision will explode future revenue by 380.37% with a vision towards success


