
Advertisement
Revenues Working Against SECOS Group Limited's (ASX:SES) Share Price Following 26% Dive
The SECOS Group Limited (ASX:SES) share price has fared very poorly over the last month, falling by a substantial 26%. For any long-term shareholders, the last month ends a year to forget by locking in a 50% share price decline.
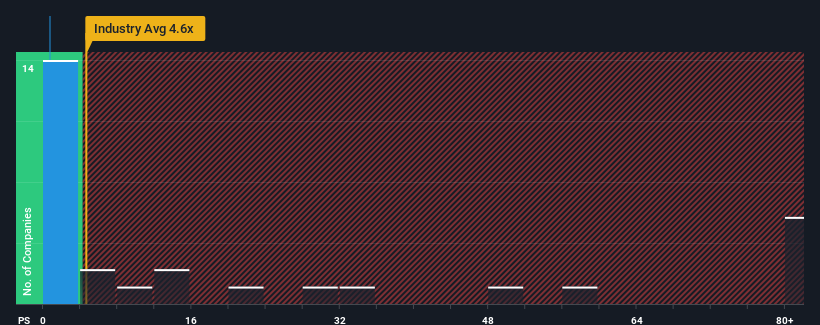
After such a large drop in price, SECOS Group's price-to-sales (or "P/S") ratio of 0.7x might make it look like a strong buy right now compared to the wider Chemicals industry in Australia, where around half of the companies have P/S ratios above 4.6x and even P/S above 34x are quite common. Nonetheless, we'd need to dig a little deeper to determine if there is a rational basis for the highly reduced P/S.
View our latest analysis for SECOS Group
What Does SECOS Group's Recent Performance Look Like?
For example, consider that SECOS Group's financial performance has been poor lately as its revenue has been in decline. One possibility is that the P/S is low because investors think the company won't do enough to avoid underperforming the broader industry in the near future. Those who are bullish on SECOS Group will be hoping that this isn't the case so that they can pick up the stock at a lower valuation.
Want the full picture on earnings, revenue and cash flow for the company? Then our free report on SECOS Group will help you shine a light on its historical performance.Is There Any Revenue Growth Forecasted For SECOS Group?
There's an inherent assumption that a company should far underperform the industry for P/S ratios like SECOS Group's to be considered reasonable.
Retrospectively, the last year delivered a frustrating 9.3% decrease to the company's top line. The last three years don't look nice either as the company has shrunk revenue by 12% in aggregate. Therefore, it's fair to say the revenue growth recently has been undesirable for the company.
In contrast to the company, the rest of the industry is expected to grow by 1,861% over the next year, which really puts the company's recent medium-term revenue decline into perspective.
With this in mind, we understand why SECOS Group's P/S is lower than most of its industry peers. Nonetheless, there's no guarantee the P/S has reached a floor yet with revenue going in reverse. There's potential for the P/S to fall to even lower levels if the company doesn't improve its top-line growth.
What Does SECOS Group's P/S Mean For Investors?
SECOS Group's P/S looks about as weak as its stock price lately. It's argued the price-to-sales ratio is an inferior measure of value within certain industries, but it can be a powerful business sentiment indicator.
It's no surprise that SECOS Group maintains its low P/S off the back of its sliding revenue over the medium-term. At this stage investors feel the potential for an improvement in revenue isn't great enough to justify a higher P/S ratio. If recent medium-term revenue trends continue, it's hard to see the share price moving strongly in either direction in the near future under these circumstances.
It is also worth noting that we have found 2 warning signs for SECOS Group (1 is a bit unpleasant!) that you need to take into consideration.
If these risks are making you reconsider your opinion on SECOS Group, explore our interactive list of high quality stocks to get an idea of what else is out there.
New: Manage All Your Stock Portfolios in One Place
We've created the ultimate portfolio companion for stock investors, and it's free.
• Connect an unlimited number of Portfolios and see your total in one currency
• Be alerted to new Warning Signs or Risks via email or mobile
• Track the Fair Value of your stocks
Have feedback on this article? Concerned about the content? Get in touch with us directly. Alternatively, email editorial-team (at) simplywallst.com.
This article by Simply Wall St is general in nature. We provide commentary based on historical data and analyst forecasts only using an unbiased methodology and our articles are not intended to be financial advice. It does not constitute a recommendation to buy or sell any stock, and does not take account of your objectives, or your financial situation. We aim to bring you long-term focused analysis driven by fundamental data. Note that our analysis may not factor in the latest price-sensitive company announcements or qualitative material. Simply Wall St has no position in any stocks mentioned.
Have feedback on this article? Concerned about the content? Get in touch with us directly. Alternatively, email editorial-team@simplywallst.com
About ASX:MCO
Myeco Group
Develops, manufactures, and sells sustainable packaging and materials in Oceanic, Asia, the United States, Europe, and Africa.
Adequate balance sheet with low risk.
Market Insights

Advertisement
Community Narratives
Finding The True Value Of A Logistics Powerhouse
Fair Value US$95.21|6.3% undervalued
NV
Community Contributor
Paradigm Biopharmaceuticals Will Lead Osteoarthritis Treatment with Zilosul's FDA Success
Fair Value AU$5.50|91.9% undervalued
AM
Community Contributor
Barrick Mining (ABX:CA): A Gold Hedge against a U.S. Shutdown
Fair Value CA$60.00|25.8% undervalued
GM
Community Contributor