
Advertisement
- Australia
- /
- Metals and Mining
- /
- ASX:PLS
Is Pilbara Minerals Limited (ASX:PLS) Expensive For A Reason? A Look At Its Intrinsic Value
Key Insights
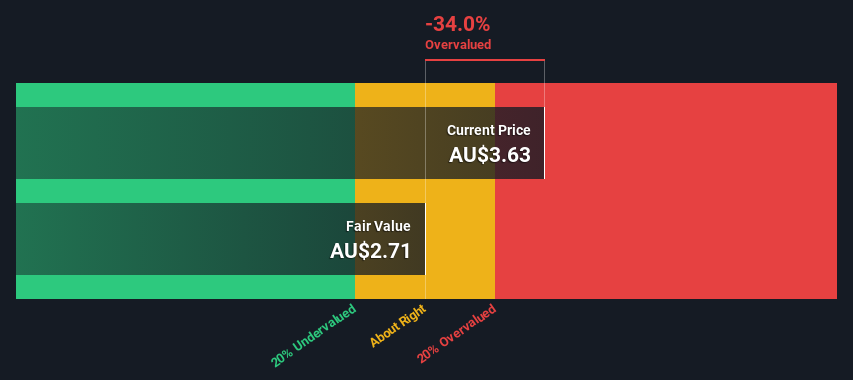
- Using the 2 Stage Free Cash Flow to Equity, Pilbara Minerals fair value estimate is AU$2.71
- Current share price of AU$3.63 suggests Pilbara Minerals is potentially 34% overvalued
- The AU$3.71 analyst price target for PLS is 37% more than our estimate of fair value
Today we'll do a simple run through of a valuation method used to estimate the attractiveness of Pilbara Minerals Limited (ASX:PLS) as an investment opportunity by taking the expected future cash flows and discounting them to today's value. We will use the Discounted Cash Flow (DCF) model on this occasion. Don't get put off by the jargon, the math behind it is actually quite straightforward.
Remember though, that there are many ways to estimate a company's value, and a DCF is just one method. If you still have some burning questions about this type of valuation, take a look at the Simply Wall St analysis model.
See our latest analysis for Pilbara Minerals
The Calculation
We are going to use a two-stage DCF model, which, as the name states, takes into account two stages of growth. The first stage is generally a higher growth period which levels off heading towards the terminal value, captured in the second 'steady growth' period. To begin with, we have to get estimates of the next ten years of cash flows. Where possible we use analyst estimates, but when these aren't available we extrapolate the previous free cash flow (FCF) from the last estimate or reported value. We assume companies with shrinking free cash flow will slow their rate of shrinkage, and that companies with growing free cash flow will see their growth rate slow, over this period. We do this to reflect that growth tends to slow more in the early years than it does in later years.
Generally we assume that a dollar today is more valuable than a dollar in the future, so we need to discount the sum of these future cash flows to arrive at a present value estimate:
10-year free cash flow (FCF) forecast
| 2024 | 2025 | 2026 | 2027 | 2028 | 2029 | 2030 | 2031 | 2032 | 2033 | |
| Levered FCF (A$, Millions) | -AU$892.8m | AU$144.5m | AU$1.01b | AU$1.04b | AU$798.0m | AU$667.3m | AU$595.2m | AU$554.0m | AU$530.7m | AU$518.6m |
| Growth Rate Estimate Source | Analyst x6 | Analyst x5 | Analyst x6 | Analyst x4 | Analyst x3 | Est @ -16.37% | Est @ -10.81% | Est @ -6.92% | Est @ -4.20% | Est @ -2.29% |
| Present Value (A$, Millions) Discounted @ 7.3% | -AU$832 | AU$125 | AU$818 | AU$785 | AU$560 | AU$436 | AU$363 | AU$314 | AU$281 | AU$256 |
("Est" = FCF growth rate estimated by Simply Wall St)
Present Value of 10-year Cash Flow (PVCF) = AU$3.1b
We now need to calculate the Terminal Value, which accounts for all the future cash flows after this ten year period. The Gordon Growth formula is used to calculate Terminal Value at a future annual growth rate equal to the 5-year average of the 10-year government bond yield of 2.2%. We discount the terminal cash flows to today's value at a cost of equity of 7.3%.
Terminal Value (TV)= FCF2033 × (1 + g) ÷ (r – g) = AU$519m× (1 + 2.2%) ÷ (7.3%– 2.2%) = AU$10b
Present Value of Terminal Value (PVTV)= TV / (1 + r)10= AU$10b÷ ( 1 + 7.3%)10= AU$5.0b
The total value is the sum of cash flows for the next ten years plus the discounted terminal value, which results in the Total Equity Value, which in this case is AU$8.2b. The last step is to then divide the equity value by the number of shares outstanding. Relative to the current share price of AU$3.6, the company appears potentially overvalued at the time of writing. The assumptions in any calculation have a big impact on the valuation, so it is better to view this as a rough estimate, not precise down to the last cent.
Important Assumptions
The calculation above is very dependent on two assumptions. The first is the discount rate and the other is the cash flows. You don't have to agree with these inputs, I recommend redoing the calculations yourself and playing with them. The DCF also does not consider the possible cyclicality of an industry, or a company's future capital requirements, so it does not give a full picture of a company's potential performance. Given that we are looking at Pilbara Minerals as potential shareholders, the cost of equity is used as the discount rate, rather than the cost of capital (or weighted average cost of capital, WACC) which accounts for debt. In this calculation we've used 7.3%, which is based on a levered beta of 1.125. Beta is a measure of a stock's volatility, compared to the market as a whole. We get our beta from the industry average beta of globally comparable companies, with an imposed limit between 0.8 and 2.0, which is a reasonable range for a stable business.
SWOT Analysis for Pilbara Minerals
Strength
- Earnings growth over the past year exceeded the industry.
- Debt is not viewed as a risk.
- Dividends are covered by earnings and cash flows.
- Dividend is in the top 25% of dividend payers in the market.
Weakness
- No major weaknesses identified for PLS.
Opportunity
- Good value based on P/E ratio compared to estimated Fair P/E ratio.
Threat
- Annual earnings are forecast to decline for the next 3 years.
Next Steps:
Whilst important, the DCF calculation shouldn't be the only metric you look at when researching a company. DCF models are not the be-all and end-all of investment valuation. Preferably you'd apply different cases and assumptions and see how they would impact the company's valuation. For instance, if the terminal value growth rate is adjusted slightly, it can dramatically alter the overall result. Why is the intrinsic value lower than the current share price? For Pilbara Minerals, there are three pertinent elements you should consider:
- Risks: We feel that you should assess the 2 warning signs for Pilbara Minerals (1 shouldn't be ignored!) we've flagged before making an investment in the company.
- Future Earnings: How does PLS's growth rate compare to its peers and the wider market? Dig deeper into the analyst consensus number for the upcoming years by interacting with our free analyst growth expectation chart.
- Other High Quality Alternatives: Do you like a good all-rounder? Explore our interactive list of high quality stocks to get an idea of what else is out there you may be missing!
PS. Simply Wall St updates its DCF calculation for every Australian stock every day, so if you want to find the intrinsic value of any other stock just search here.
New: Manage All Your Stock Portfolios in One Place
We've created the ultimate portfolio companion for stock investors, and it's free.
• Connect an unlimited number of Portfolios and see your total in one currency
• Be alerted to new Warning Signs or Risks via email or mobile
• Track the Fair Value of your stocks
Have feedback on this article? Concerned about the content? Get in touch with us directly. Alternatively, email editorial-team (at) simplywallst.com.
This article by Simply Wall St is general in nature. We provide commentary based on historical data and analyst forecasts only using an unbiased methodology and our articles are not intended to be financial advice. It does not constitute a recommendation to buy or sell any stock, and does not take account of your objectives, or your financial situation. We aim to bring you long-term focused analysis driven by fundamental data. Note that our analysis may not factor in the latest price-sensitive company announcements or qualitative material. Simply Wall St has no position in any stocks mentioned.
About ASX:PLS
Pilbara Minerals
Engages in the exploration, development, and operation of mineral resources in Australia.
Reasonable growth potential with adequate balance sheet.
Similar Companies
Market Insights

Advertisement
Community Narratives
WhiteCap Is Positioned To Profit Regardless Of Trump's Policy 
Fair Value CA$22.60|60.9% undervalued
ST
Equity Analyst and Writer
Microsoft's Evolution Will Drive Revenue to New Heights Fueled by AI
Fair Value US$360.00|31.3% overvalued
BR
Community Contributor
A CASE FOR USD$2.50 (CAD$3.44) BY 2028 (A 5-10 BAGGER)
Fair Value CA$3.44|87.1% undervalued
AG
Community Contributor