Advertisement
- Australia
- /
- Metals and Mining
- /
- ASX:PLS
How the Recent Lithium Price Rebound Is Shaping Pilbara Minerals’ Valuation in 2025

Simply Wall St
Reviewed by Simply Wall St
Trying to figure out what to do with Pilbara Minerals’ stock right now? You’re not alone. Over the past month, the share price has bounced back, climbing over 11.6%. That jump follows a 6.6% rise just this past week, hinting that investors might be spotting new reasons for optimism, or maybe they’re rethinking the risks around lithium exposure in today’s shifting market. Of course, the bigger picture includes some sobering moves: a 1-year dip of 18.3%, and a steeper 44% slide over 3 years, while the truly long-term holders have still seen gains of more than 740% over 5 years.
These numbers reflect not just shifting demand and commodity prices, but also Pilbara’s evolving place in the global lithium supply chain. Recent industry developments, such as global efforts to ramp up battery production and changing forecasts for electric vehicle demand, have shifted how investors are valuing mining stocks across the board, and Pilbara is right in the thick of it. It means volatility, often, but also room for growth if sentiment or fundamentals turn again.
So, is Pilbara Minerals undervalued after this rocky run? By our standard checklist of valuation methods, the company only notched 1 out of 6 possible “undervalued” points in its latest value score. That number might raise eyebrows or prompt second looks, but before drawing any conclusions, let’s dive into what those valuation checks actually mean, and why there’s more to get from this analysis than just a single score.
Pilbara Minerals scores just 1/6 on our valuation checks. See what other red flags we found in the full valuation breakdown.Approach 1: Pilbara Minerals Dividend Discount Model (DDM) Analysis
The Dividend Discount Model (DDM) is a valuation approach that estimates a company's intrinsic value by projecting future dividend payments and discounting them back to today. For Pilbara Minerals, this involves considering its current dividend policy as well as the company's potential to grow those dividends over time.
Currently, Pilbara Minerals pays an annual dividend per share (DPS) of A$0.0127. With a robust return on equity of 47.46% and a payout ratio of 28.73%, the model assumes a capped dividend growth rate of 3.11%, based on both recent performance and industry outlook. (This growth rate was scaled back from a much higher raw figure.) The DDM uses these numbers to estimate how sustainable and sizeable future payouts could be and calculates how much those future dividends are worth in today’s dollars.
Based on this method, the calculated intrinsic value is A$0.31 per share. Relative to the current market price, this suggests Pilbara Minerals stock is trading about 678.7% above its DDM value, making it appear significantly overvalued by this measure alone. Investors who focus on dividend-based returns may consider the current price high relative to the underlying payout outlook.
Result: OVERVALUED
Head to the Valuation section of our Company Report for more details on how we arrive at this Fair Value for Pilbara Minerals.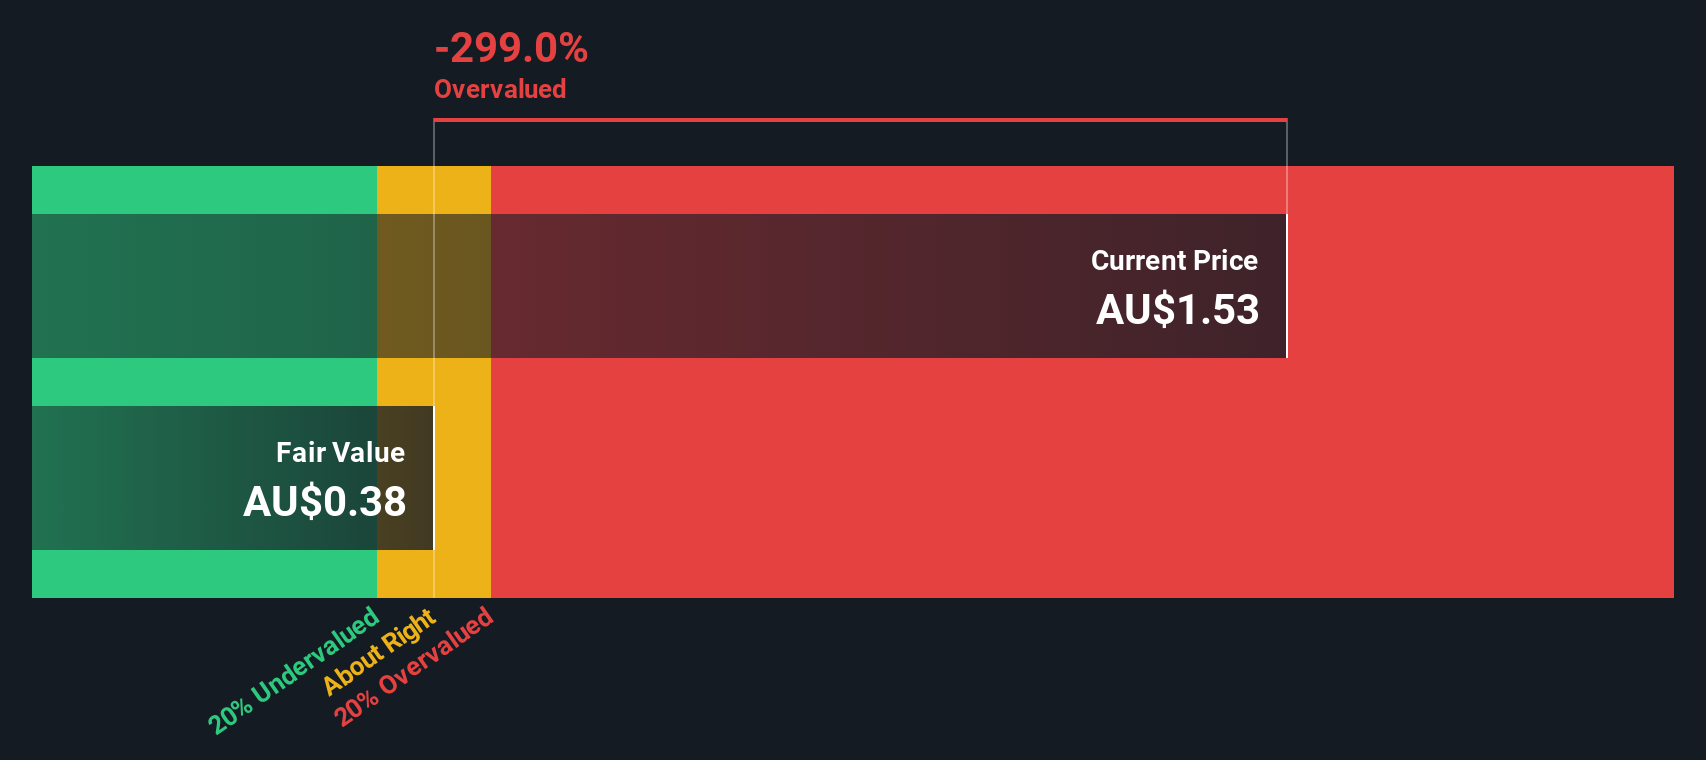
Approach 2: Pilbara Minerals Price vs Sales
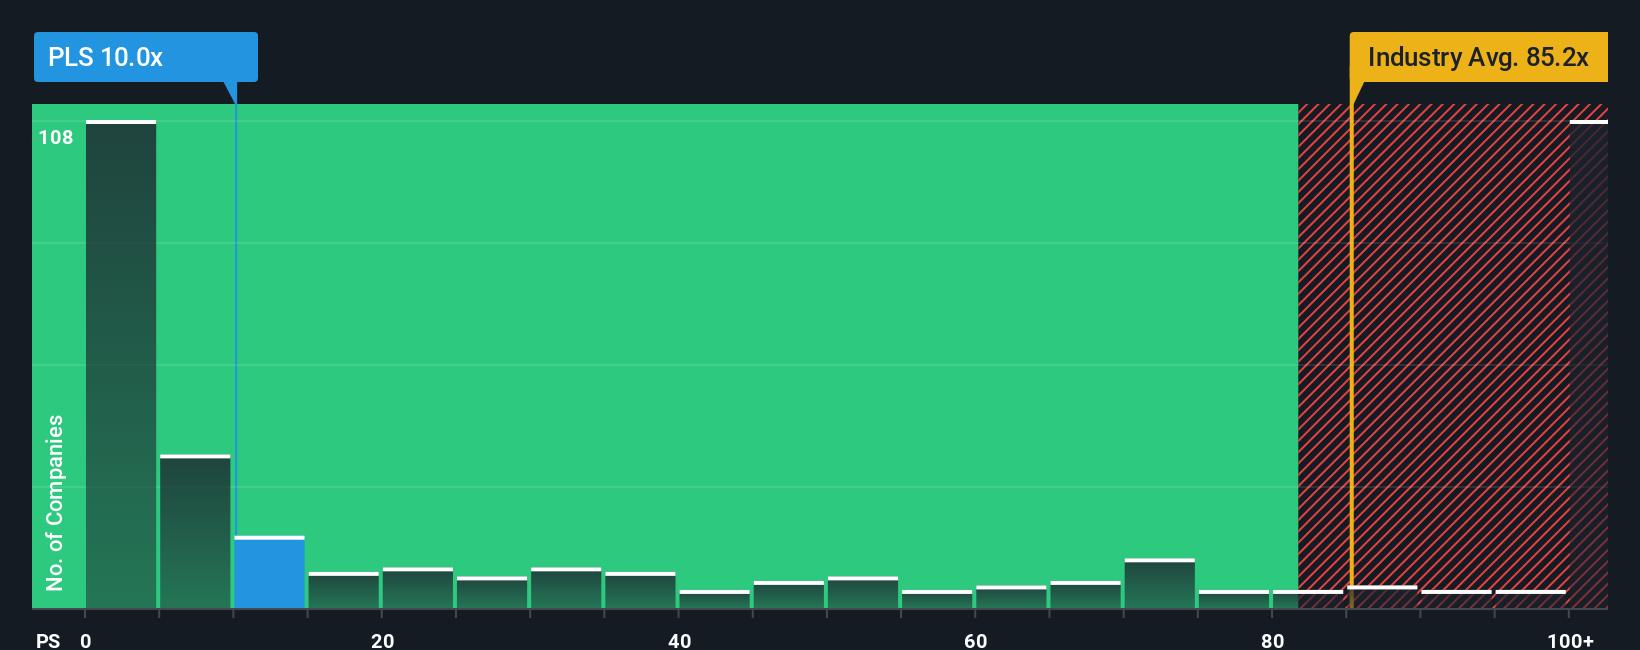
The price-to-sales (P/S) ratio is often a go-to valuation metric for companies like Pilbara Minerals that are generating sales, but where earnings may be volatile due to market cycles or recent investments. For mining and resources companies, revenue streams often remain meaningful even in periods when net profits are subdued. This makes the P/S ratio suitable for comparing value across firms in the sector.
Investors typically look for a P/S multiple that fits the company’s growth outlook and risk profile. Higher expected sales growth or a strong position in a growing market can justify a higher P/S ratio, while increased risks or margin pressure might warrant a lower one. Pilbara Minerals is currently trading at a P/S ratio of 10.09x. For context, the industry average is 79.83x, and Pilbara’s peer average is about 9.94x, placing it right in line with comparable lithium and mining names.
Simply Wall St’s proprietary “Fair Ratio” calculation takes several key company specifics into account, including Pilbara’s profit margins, future growth expectations, market cap, risks, and its industry context. This score, at 1.48x, is tailored to the factors that matter most, rather than just comparing Pilbara to the broader industry or peer group, which can mask important differences. By this Fair Ratio, Pilbara’s current P/S multiple looks substantially higher than what fundamentals might justify, indicating investors are paying a premium that goes beyond the company’s key drivers.
Result: OVERVALUED
Upgrade Your Decision Making: Choose your Pilbara Minerals Narrative
Earlier we mentioned that there is an even better way to understand valuation, so let’s introduce you to Narratives. A Narrative is a simple, accessible way to connect your view on a company’s future with financial forecasts and a resulting fair value. This approach lets you tell the story behind your numbers instead of relying solely on historical ratios or analyst targets.
With Narratives, you combine your expectations for Pilbara Minerals, such as revenue growth, earnings, and margins, with reasonable assumptions to generate your own fair value and see how it compares to the current price. This approach is easy to use, available on Simply Wall St’s Community page (used by millions worldwide), and it empowers you to see, refine, or challenge perspectives from investors with different backgrounds.
Narratives are dynamic and automatically update as soon as new news or earnings are released, meaning your view always reflects the latest information. For example, one investor looking at Pilbara Minerals may believe in rapid demand growth and margin expansion, setting a bullish fair value of A$2.8. Another investor, concerned about falling lithium prices and expansion risks, might estimate fair value at just A$1.1. Your Narrative helps you decide when the share price offers opportunity or risk, based on what you actually believe will happen next.
Do you think there's more to the story for Pilbara Minerals? Create your own Narrative to let the Community know!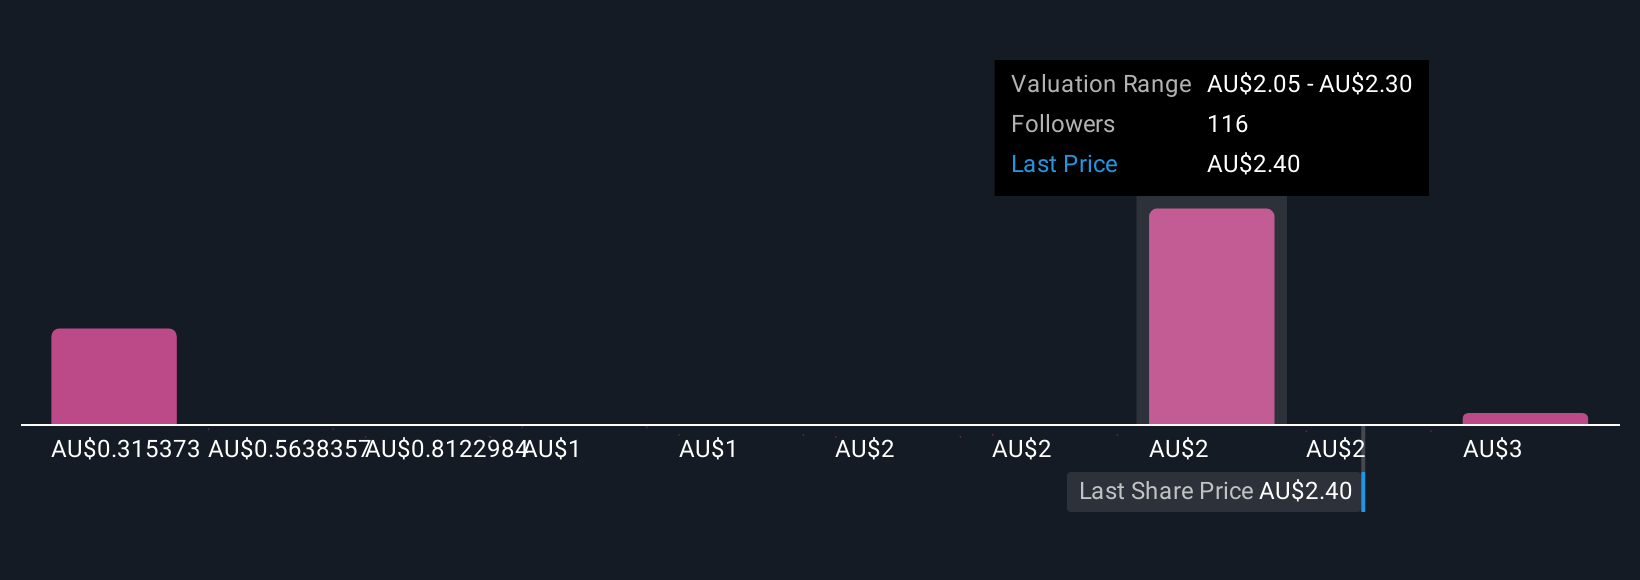
This article by Simply Wall St is general in nature. We provide commentary based on historical data and analyst forecasts only using an unbiased methodology and our articles are not intended to be financial advice. It does not constitute a recommendation to buy or sell any stock, and does not take account of your objectives, or your financial situation. We aim to bring you long-term focused analysis driven by fundamental data. Note that our analysis may not factor in the latest price-sensitive company announcements or qualitative material. Simply Wall St has no position in any stocks mentioned.
New: Manage All Your Stock Portfolios in One Place
We've created the ultimate portfolio companion for stock investors, and it's free.
• Connect an unlimited number of Portfolios and see your total in one currency
• Be alerted to new Warning Signs or Risks via email or mobile
• Track the Fair Value of your stocks
Have feedback on this article? Concerned about the content? Get in touch with us directly. Alternatively, email editorial-team@simplywallst.com
About ASX:PLS
Pilbara Minerals
Engages in the exploration, development, and operation of mineral resources in Australia.
Excellent balance sheet with reasonable growth potential.
Similar Companies
Market Insights

Advertisement
Community Narratives
MINISO's fair value is projected at 26.69 with an anticipated PE ratio shift of 20x
Fair Value US$24.03|9.0% undervalued
BE
Community Contributor
Procter & Gamble: A Dividend Giant Facing Slowing Growth
Fair Value US$119.81|23.5% overvalued
AN
Community Contributor
Eli Lilly's Future Growth Driven by Tirzepatide and Favorable Market Conditions
Fair Value US$1.19k|14.4% undervalued
EA
Community Contributor