
Advertisement
- Australia
- /
- Metals and Mining
- /
- ASX:OMH
We Like These Underlying Return On Capital Trends At OM Holdings (ASX:OMH)
Finding a business that has the potential to grow substantially is not easy, but it is possible if we look at a few key financial metrics. In a perfect world, we'd like to see a company investing more capital into its business and ideally the returns earned from that capital are also increasing. This shows us that it's a compounding machine, able to continually reinvest its earnings back into the business and generate higher returns. Speaking of which, we noticed some great changes in OM Holdings' (ASX:OMH) returns on capital, so let's have a look.
Return On Capital Employed (ROCE): What Is It?
Just to clarify if you're unsure, ROCE is a metric for evaluating how much pre-tax income (in percentage terms) a company earns on the capital invested in its business. To calculate this metric for OM Holdings, this is the formula:
Return on Capital Employed = Earnings Before Interest and Tax (EBIT) ÷ (Total Assets - Current Liabilities)
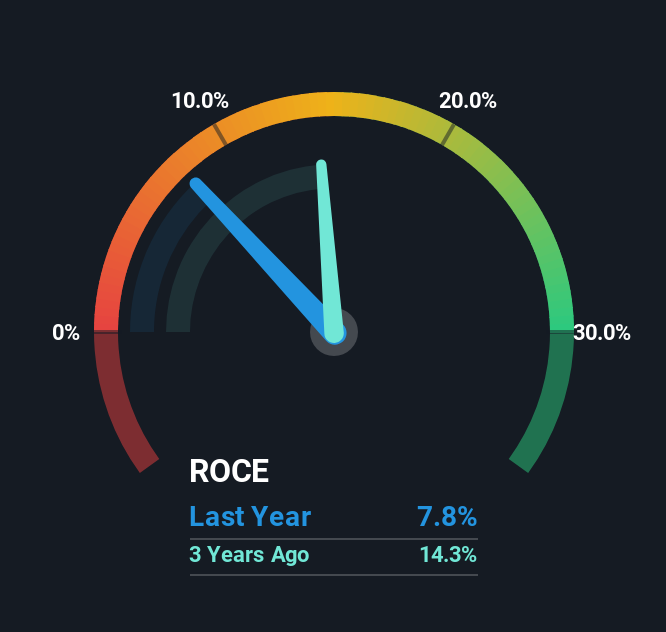
0.078 = US$42m ÷ (US$941m - US$402m) (Based on the trailing twelve months to December 2024).
Thus, OM Holdings has an ROCE of 7.8%. Even though it's in line with the industry average of 7.9%, it's still a low return by itself.
Check out our latest analysis for OM Holdings
In the above chart we have measured OM Holdings' prior ROCE against its prior performance, but the future is arguably more important. If you're interested, you can view the analysts predictions in our free analyst report for OM Holdings .
So How Is OM Holdings' ROCE Trending?
You'd find it hard not to be impressed with the ROCE trend at OM Holdings. We found that the returns on capital employed over the last five years have risen by 21%. That's a very favorable trend because this means that the company is earning more per dollar of capital that's being employed. In regards to capital employed, OM Holdings appears to been achieving more with less, since the business is using 22% less capital to run its operation. If this trend continues, the business might be getting more efficient but it's shrinking in terms of total assets.
For the record though, there was a noticeable increase in the company's current liabilities over the period, so we would attribute some of the ROCE growth to that. Essentially the business now has suppliers or short-term creditors funding about 43% of its operations, which isn't ideal. And with current liabilities at those levels, that's pretty high.
The Bottom Line
In the end, OM Holdings has proven it's capital allocation skills are good with those higher returns from less amount of capital. And since the stock has fallen 18% over the last five years, there might be an opportunity here. With that in mind, we believe the promising trends warrant this stock for further investigation.
One more thing to note, we've identified 1 warning sign with OM Holdings and understanding this should be part of your investment process.
For those who like to invest in solid companies, check out this free list of companies with solid balance sheets and high returns on equity.
New: AI Stock Screener & Alerts
Our new AI Stock Screener scans the market every day to uncover opportunities.
• Dividend Powerhouses (3%+ Yield)
• Undervalued Small Caps with Insider Buying
• High growth Tech and AI Companies
Or build your own from over 50 metrics.
Have feedback on this article? Concerned about the content? Get in touch with us directly. Alternatively, email editorial-team (at) simplywallst.com.
This article by Simply Wall St is general in nature. We provide commentary based on historical data and analyst forecasts only using an unbiased methodology and our articles are not intended to be financial advice. It does not constitute a recommendation to buy or sell any stock, and does not take account of your objectives, or your financial situation. We aim to bring you long-term focused analysis driven by fundamental data. Note that our analysis may not factor in the latest price-sensitive company announcements or qualitative material. Simply Wall St has no position in any stocks mentioned.
About ASX:OMH
OM Holdings
An investment holding company, engages in mining, smelting, trading, and marketing manganese ores and ferroalloys worldwide.
Excellent balance sheet with reasonable growth potential.
Similar Companies
Market Insights

Advertisement
Community Narratives
MicroVision will explode future revenue by 380.37% with a vision towards success
Fair Value US$60.00|98.5% undervalued
TH
Community Contributor
The Indispensable Artery for a New North American Economy
Fair Value CA$132.87|2.3% undervalued
TI
Community Contributor