- Australia
- /
- Capital Markets
- /
- ASX:CAF
Centrepoint Alliance Leads The Charge Among 3 ASX Penny Stocks

Reviewed by Simply Wall St

The Australian market is experiencing a cautious start, with the ASX 200 expected to open slightly lower following Wall Street's recent pullback amidst ongoing geopolitical tensions and domestic financial challenges. In such a climate, investors often look for opportunities in less conventional areas like penny stocks, which can offer growth potential at lower price points. Despite being an outdated term, penny stocks represent smaller or newer companies that can present significant upside when backed by strong financials and solid fundamentals.
Top 10 Penny Stocks In Australia
| Name | Share Price | Market Cap | Financial Health Rating |
| LaserBond (ASX:LBL) | A$0.6025 | A$70.63M | ★★★★★★ |
| Embark Early Education (ASX:EVO) | A$0.80 | A$146.79M | ★★★★☆☆ |
| Helloworld Travel (ASX:HLO) | A$2.04 | A$332.15M | ★★★★★★ |
| Austin Engineering (ASX:ANG) | A$0.545 | A$337.98M | ★★★★★☆ |
| MaxiPARTS (ASX:MXI) | A$1.89 | A$104.55M | ★★★★★★ |
| SHAPE Australia (ASX:SHA) | A$2.75 | A$228.01M | ★★★★★★ |
| Navigator Global Investments (ASX:NGI) | A$1.685 | A$825.78M | ★★★★★☆ |
| EZZ Life Science Holdings (ASX:EZZ) | A$2.95 | A$131.05M | ★★★★★★ |
| Atlas Pearls (ASX:ATP) | A$0.155 | A$67.53M | ★★★★★★ |
| Servcorp (ASX:SRV) | A$4.93 | A$486.42M | ★★★★☆☆ |
Click here to see the full list of 1,039 stocks from our ASX Penny Stocks screener.
Here we highlight a subset of our preferred stocks from the screener.
Centrepoint Alliance (ASX:CAF)
Simply Wall St Financial Health Rating: ★★★★★☆
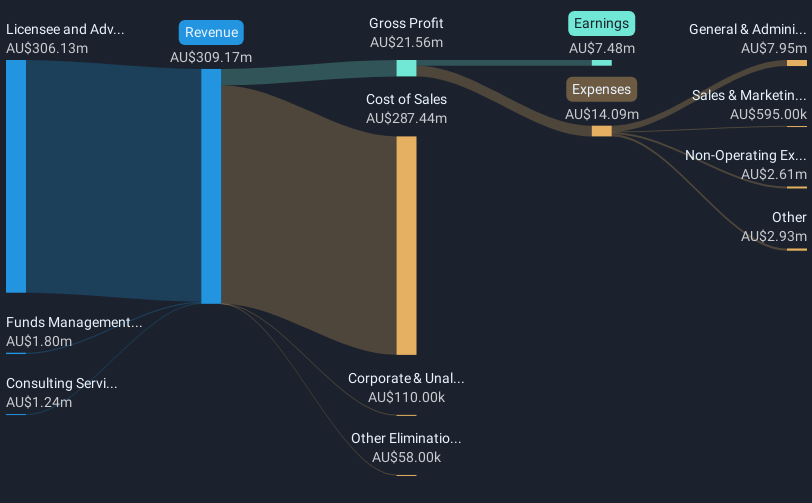
Overview: Centrepoint Alliance Limited, along with its subsidiaries, offers financial services in Australia and has a market capitalization of A$61.65 million.
Operations: The company's revenue is primarily derived from Licensee and Advice Services (A$285.39 million), with additional contributions from Consulting Services (A$1.25 million) and Funds Management and Administration (A$1.99 million).
Market Cap: A$61.65M
Centrepoint Alliance has shown promising financial metrics with a high Return on Equity of 23.3% and earnings growth surpassing the industry average. The company maintains strong cash flow coverage for its debt, indicating robust financial health, and has not significantly diluted shareholders recently. Despite an inexperienced board, Centrepoint's management team is seasoned, contributing to stable operations. Recent earnings reports highlight improved profit margins and increased net income year-over-year. However, the dividend track record remains unstable with recent decreases. The company is actively seeking acquisitions to bolster growth beyond organic strategies as discussed in its AGM.
- Get an in-depth perspective on Centrepoint Alliance's performance by reading our balance sheet health report here.
- Assess Centrepoint Alliance's previous results with our detailed historical performance reports.

Mitchell Services (ASX:MSV)
Simply Wall St Financial Health Rating: ★★★★★★
Overview: Mitchell Services Limited offers exploration, mine site, and geotechnical drilling services to the exploration, mining, and energy sectors in Australia with a market cap of A$73.56 million.
Operations: The company generates revenue of A$237.05 million from providing drilling services to the mining industry.
Market Cap: A$73.56M
Mitchell Services Limited demonstrates solid financial health with no debt and short-term assets exceeding liabilities, ensuring liquidity. The company has shown earnings growth of 20.6% over the past year, surpassing industry averages, although its Return on Equity remains low at 14%. Despite a large one-off gain impacting recent results, Mitchell's profitability has improved from previous years. The stock trades significantly below estimated fair value but faces challenges with dividend sustainability as earnings may not cover payouts. Recent guidance suggests weaker FY25 earnings compared to FY24, reflecting potential headwinds in maintaining current growth momentum.
- Take a closer look at Mitchell Services' potential here in our financial health report.
- Gain insights into Mitchell Services' future direction by reviewing our growth report.

Omega Oil & Gas (ASX:OMA)
Simply Wall St Financial Health Rating: ★★★★★★
Overview: Omega Oil & Gas Limited focuses on the evaluation and exploration of oil and gas in Australia, with a market cap of A$80.20 million.
Operations: Omega Oil & Gas Limited has not reported any specific revenue segments.
Market Cap: A$80.2M
Omega Oil & Gas Limited, with a market cap of A$80.20 million, operates in the oil and gas exploration sector and is currently pre-revenue. The company has no debt but has experienced shareholder dilution over the past year. Its short-term assets of A$26 million comfortably cover both short-term and long-term liabilities, providing a solid financial cushion. Despite reporting a reduced net loss of A$2.22 million for FY2024 compared to the previous year, Omega remains unprofitable with negative return on equity. The company's management team is relatively new, which may impact strategic continuity as it navigates its growth trajectory.
- Jump into the full analysis health report here for a deeper understanding of Omega Oil & Gas.
- Explore historical data to track Omega Oil & Gas' performance over time in our past results report.

Key Takeaways
- Access the full spectrum of 1,039 ASX Penny Stocks by clicking on this link.
- Are these companies part of your investment strategy? Use Simply Wall St to consolidate your holdings into a portfolio and gain insights with our comprehensive analysis tools.
- Simply Wall St is your key to unlocking global market trends, a free user-friendly app for forward-thinking investors.
Contemplating Other Strategies?
- Explore high-performing small cap companies that haven't yet garnered significant analyst attention.
- Jump on the AI train with fast growing tech companies forging a new era of innovation.
- Find companies with promising cash flow potential yet trading below their fair value.
This article by Simply Wall St is general in nature. We provide commentary based on historical data and analyst forecasts only using an unbiased methodology and our articles are not intended to be financial advice. It does not constitute a recommendation to buy or sell any stock, and does not take account of your objectives, or your financial situation. We aim to bring you long-term focused analysis driven by fundamental data. Note that our analysis may not factor in the latest price-sensitive company announcements or qualitative material. Simply Wall St has no position in any stocks mentioned.
New: AI Stock Screener & Alerts
Our new AI Stock Screener scans the market every day to uncover opportunities.
• Dividend Powerhouses (3%+ Yield)
• Undervalued Small Caps with Insider Buying
• High growth Tech and AI Companies
Or build your own from over 50 metrics.
Have feedback on this article? Concerned about the content? Get in touch with us directly. Alternatively, email editorial-team@simplywallst.com
About ASX:CAF
Solid track record with excellent balance sheet and pays a dividend.

