- Australia
- /
- Metals and Mining
- /
- ASX:MKR
Manuka Resources Limited's (ASX:MKR) 31% Dip In Price Shows Sentiment Is Matching Revenues

To the annoyance of some shareholders, Manuka Resources Limited (ASX:MKR) shares are down a considerable 31% in the last month, which continues a horrid run for the company. The recent drop completes a disastrous twelve months for shareholders, who are sitting on a 53% loss during that time.
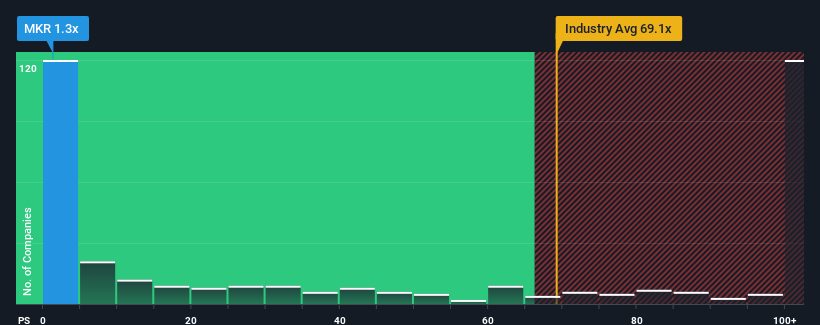
Following the heavy fall in price, Manuka Resources may be sending very bullish signals at the moment with its price-to-sales (or "P/S") ratio of 1.3x, since almost half of all companies in the Metals and Mining industry in Australia have P/S ratios greater than 69.1x and even P/S higher than 459x are not unusual. Nonetheless, we'd need to dig a little deeper to determine if there is a rational basis for the highly reduced P/S.
Check out our latest analysis for Manuka Resources
What Does Manuka Resources' Recent Performance Look Like?
For example, consider that Manuka Resources' financial performance has been poor lately as its revenue has been in decline. Perhaps the market believes the recent revenue performance isn't good enough to keep up the industry, causing the P/S ratio to suffer. However, if this doesn't eventuate then existing shareholders may be feeling optimistic about the future direction of the share price.
We don't have analyst forecasts, but you can see how recent trends are setting up the company for the future by checking out our free report on Manuka Resources' earnings, revenue and cash flow.Do Revenue Forecasts Match The Low P/S Ratio?
Manuka Resources' P/S ratio would be typical for a company that's expected to deliver very poor growth or even falling revenue, and importantly, perform much worse than the industry.
In reviewing the last year of financials, we were disheartened to see the company's revenues fell to the tune of 34%. As a result, revenue from three years ago have also fallen 48% overall. So unfortunately, we have to acknowledge that the company has not done a great job of growing revenue over that time.
Comparing that to the industry, which is predicted to deliver 42% growth in the next 12 months, the company's downward momentum based on recent medium-term revenue results is a sobering picture.
With this in mind, we understand why Manuka Resources' P/S is lower than most of its industry peers. Nonetheless, there's no guarantee the P/S has reached a floor yet with revenue going in reverse. Even just maintaining these prices could be difficult to achieve as recent revenue trends are already weighing down the shares.
The Key Takeaway
Shares in Manuka Resources have plummeted and its P/S has followed suit. While the price-to-sales ratio shouldn't be the defining factor in whether you buy a stock or not, it's quite a capable barometer of revenue expectations.
Our examination of Manuka Resources confirms that the company's shrinking revenue over the past medium-term is a key factor in its low price-to-sales ratio, given the industry is projected to grow. Right now shareholders are accepting the low P/S as they concede future revenue probably won't provide any pleasant surprises either. If recent medium-term revenue trends continue, it's hard to see the share price moving strongly in either direction in the near future under these circumstances.
Before you settle on your opinion, we've discovered 4 warning signs for Manuka Resources (1 makes us a bit uncomfortable!) that you should be aware of.
If companies with solid past earnings growth is up your alley, you may wish to see this free collection of other companies with strong earnings growth and low P/E ratios.
The New Payments ETF Is Live on NASDAQ:
Money is moving to real-time rails, and a newly listed ETF now gives investors direct exposure. Fast settlement. Institutional custody. Simple access.
Explore how this launch could reshape portfolios
Sponsored ContentNew: Manage All Your Stock Portfolios in One Place
We've created the ultimate portfolio companion for stock investors, and it's free.
• Connect an unlimited number of Portfolios and see your total in one currency
• Be alerted to new Warning Signs or Risks via email or mobile
• Track the Fair Value of your stocks
Have feedback on this article? Concerned about the content? Get in touch with us directly. Alternatively, email editorial-team (at) simplywallst.com.
This article by Simply Wall St is general in nature. We provide commentary based on historical data and analyst forecasts only using an unbiased methodology and our articles are not intended to be financial advice. It does not constitute a recommendation to buy or sell any stock, and does not take account of your objectives, or your financial situation. We aim to bring you long-term focused analysis driven by fundamental data. Note that our analysis may not factor in the latest price-sensitive company announcements or qualitative material. Simply Wall St has no position in any stocks mentioned.
About ASX:MKR
Manuka Resources
Engages in the exploration and development of gold, silver, iron, titanium, and vanadium properties in Australia and New Zealand.
Moderate risk with mediocre balance sheet.
Market Insights

Weekly Picks

Early mover in a fast growing industry. Likely to experience share price volatility as they scale


A case for CA$31.80 (undiluted), aka 8,616% upside from CA$0.37 (an 86 bagger!).


Moderation and Stabilisation: HOLD: Fair Price based on a 4-year Cycle is $12.08
Recently Updated Narratives

Airbnb Stock: Platform Growth in a World of Saturation and Scrutiny

Clarivate Stock: When Data Becomes the Backbone of Innovation and Law

Adobe Stock: AI-Fueled ARR Growth Pushes Guidance Higher, But Cost Pressures Loom
Popular Narratives


Crazy Undervalued 42 Baggers Silver Play (Active & Running Mine)


NVDA: Expanding AI Demand Will Drive Major Data Center Investments Through 2026


MicroVision will explode future revenue by 380.37% with a vision towards success
Trending Discussion
