Stock Analysis
- Australia
- /
- Metals and Mining
- /
- ASX:IMD
Imdex (ASX:IMD) investors are up 7.6% in the past week, but earnings have declined over the last five years


When you buy shares in a company, it's worth keeping in mind the possibility that it could fail, and you could lose your money. But on the bright side, you can make far more than 100% on a really good stock. For example, the Imdex Limited (ASX:IMD) share price has soared 119% in the last half decade. Most would be very happy with that. It's also good to see the share price up 18% over the last quarter.
On the back of a solid 7-day performance, let's check what role the company's fundamentals have played in driving long term shareholder returns.
Check out our latest analysis for Imdex
In his essay The Superinvestors of Graham-and-Doddsville Warren Buffett described how share prices do not always rationally reflect the value of a business. By comparing earnings per share (EPS) and share price changes over time, we can get a feel for how investor attitudes to a company have morphed over time.
Imdex's earnings per share are down 2.6% per year, despite strong share price performance over five years.
So it's hard to argue that the earnings per share are the best metric to judge the company, as it may not be optimized for profits at this point. Therefore, it's worth taking a look at other metrics to try to understand the share price movements.
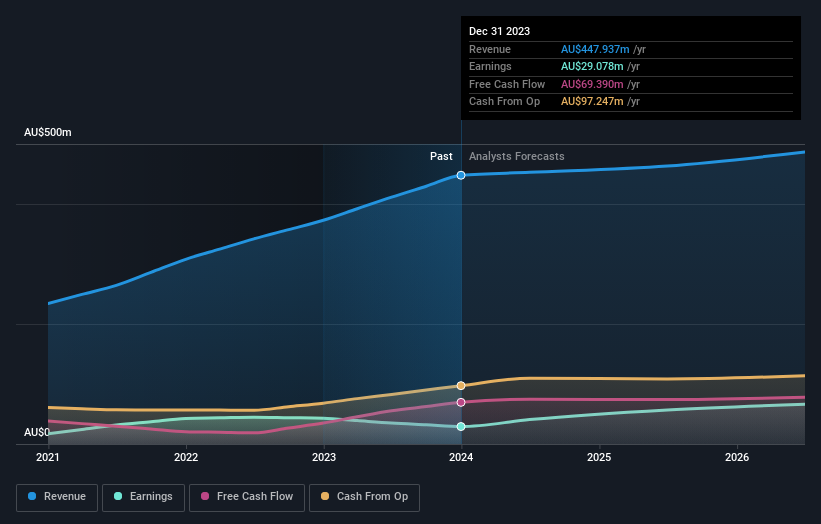
The modest 1.6% dividend yield is unlikely to be propping up the share price. On the other hand, Imdex's revenue is growing nicely, at a compound rate of 14% over the last five years. It's quite possible that management are prioritizing revenue growth over EPS growth at the moment.
The company's revenue and earnings (over time) are depicted in the image below (click to see the exact numbers).
Take a more thorough look at Imdex's financial health with this free report on its balance sheet.
What About Dividends?
As well as measuring the share price return, investors should also consider the total shareholder return (TSR). The TSR is a return calculation that accounts for the value of cash dividends (assuming that any dividend received was reinvested) and the calculated value of any discounted capital raisings and spin-offs. It's fair to say that the TSR gives a more complete picture for stocks that pay a dividend. We note that for Imdex the TSR over the last 5 years was 145%, which is better than the share price return mentioned above. And there's no prize for guessing that the dividend payments largely explain the divergence!
A Different Perspective
It's good to see that Imdex has rewarded shareholders with a total shareholder return of 26% in the last twelve months. That's including the dividend. That gain is better than the annual TSR over five years, which is 20%. Therefore it seems like sentiment around the company has been positive lately. Given the share price momentum remains strong, it might be worth taking a closer look at the stock, lest you miss an opportunity. While it is well worth considering the different impacts that market conditions can have on the share price, there are other factors that are even more important. Consider for instance, the ever-present spectre of investment risk. We've identified 1 warning sign with Imdex , and understanding them should be part of your investment process.
If you would prefer to check out another company -- one with potentially superior financials -- then do not miss this free list of companies that have proven they can grow earnings.
Please note, the market returns quoted in this article reflect the market weighted average returns of stocks that currently trade on Australian exchanges.
Valuation is complex, but we're helping make it simple.
Find out whether Imdex is potentially over or undervalued by checking out our comprehensive analysis, which includes fair value estimates, risks and warnings, dividends, insider transactions and financial health.
View the Free AnalysisHave feedback on this article? Concerned about the content? Get in touch with us directly. Alternatively, email editorial-team (at) simplywallst.com.
This article by Simply Wall St is general in nature. We provide commentary based on historical data and analyst forecasts only using an unbiased methodology and our articles are not intended to be financial advice. It does not constitute a recommendation to buy or sell any stock, and does not take account of your objectives, or your financial situation. We aim to bring you long-term focused analysis driven by fundamental data. Note that our analysis may not factor in the latest price-sensitive company announcements or qualitative material. Simply Wall St has no position in any stocks mentioned.
About ASX:IMD
Imdex
Provides drilling optimization products and sensors for the minerals industry in the Asia-Pacific, Africa, Europe, and the Americas.
Excellent balance sheet with moderate growth potential.
