
Advertisement
- Australia
- /
- Metals and Mining
- /
- ASX:IMA
Shareholders Are Thrilled That The Image Resources (ASX:IMA) Share Price Increased 175%
While Image Resources NL (ASX:IMA) shareholders are probably generally happy, the stock hasn't had particularly good run recently, with the share price falling 13% in the last quarter. But that scarcely detracts from the really solid long term returns generated by the company over five years. It's fair to say most would be happy with 175% the gain in that time. So while it's never fun to see a share price fall, it's important to look at a longer time horizon. Ultimately business performance will determine whether the stock price continues the positive long term trend. While the long term returns are impressive, we do have some sympathy for those who bought more recently, given the 27% drop, in the last year.
Check out our latest analysis for Image Resources
There is no denying that markets are sometimes efficient, but prices do not always reflect underlying business performance. One imperfect but simple way to consider how the market perception of a company has shifted is to compare the change in the earnings per share (EPS) with the share price movement.
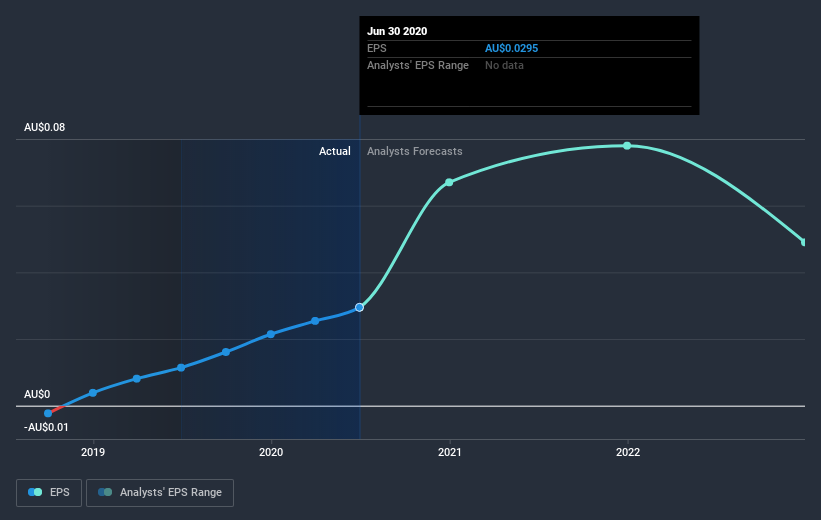
During the last half decade, Image Resources became profitable. Sometimes, the start of profitability is a major inflection point that can signal fast earnings growth to come, which in turn justifies very strong share price gains.
The company's earnings per share (over time) is depicted in the image below (click to see the exact numbers).
It is of course excellent to see how Image Resources has grown profits over the years, but the future is more important for shareholders. If you are thinking of buying or selling Image Resources stock, you should check out this FREE detailed report on its balance sheet.
What about the Total Shareholder Return (TSR)?
We'd be remiss not to mention the difference between Image Resources' total shareholder return (TSR) and its share price return. The TSR attempts to capture the value of dividends (as if they were reinvested) as well as any spin-offs or discounted capital raisings offered to shareholders. We note that Image Resources' TSR, at 189% is higher than its share price return of 175%. When you consider it hasn't been paying a dividend, this data suggests shareholders have benefitted from a spin-off, or had the opportunity to acquire attractively priced shares in a discounted capital raising.
A Different Perspective
Investors in Image Resources had a tough year, with a total loss of 27%, against a market gain of about 3.0%. However, keep in mind that even the best stocks will sometimes underperform the market over a twelve month period. On the bright side, long term shareholders have made money, with a gain of 24% per year over half a decade. It could be that the recent sell-off is an opportunity, so it may be worth checking the fundamental data for signs of a long term growth trend. Most investors take the time to check the data on insider transactions. You can click here to see if insiders have been buying or selling.
Of course Image Resources may not be the best stock to buy. So you may wish to see this free collection of growth stocks.
Please note, the market returns quoted in this article reflect the market weighted average returns of stocks that currently trade on AU exchanges.
If you decide to trade Image Resources, use the lowest-cost* platform that is rated #1 Overall by Barron’s, Interactive Brokers. Trade stocks, options, futures, forex, bonds and funds on 135 markets, all from a single integrated account. Promoted
New: AI Stock Screener & Alerts
Our new AI Stock Screener scans the market every day to uncover opportunities.
• Dividend Powerhouses (3%+ Yield)
• Undervalued Small Caps with Insider Buying
• High growth Tech and AI Companies
Or build your own from over 50 metrics.
This article by Simply Wall St is general in nature. It does not constitute a recommendation to buy or sell any stock, and does not take account of your objectives, or your financial situation. We aim to bring you long-term focused analysis driven by fundamental data. Note that our analysis may not factor in the latest price-sensitive company announcements or qualitative material. Simply Wall St has no position in any stocks mentioned.
*Interactive Brokers Rated Lowest Cost Broker by StockBrokers.com Annual Online Review 2020
Have feedback on this article? Concerned about the content? Get in touch with us directly. Alternatively, email editorial-team (at) simplywallst.com.
About ASX:IMA
Image Resources
Engages in the production and exploration of mineral sands in Western Australia.
High growth potential and slightly overvalued.
Similar Companies
Market Insights

Advertisement
Community Narratives
MicroVision will explode future revenue by 380.37% with a vision towards success
Fair Value US$60.00|98.5% undervalued
TH
Community Contributor
The Indispensable Artery for a New North American Economy
Fair Value CA$132.87|2.3% undervalued
TI
Community Contributor