
Advertisement
- Australia
- /
- Metals and Mining
- /
- ASX:GRR
Grange Resources' (ASX:GRR three-year decrease in earnings delivers investors with a 6.7% loss

Many investors define successful investing as beating the market average over the long term. But its virtually certain that sometimes you will buy stocks that fall short of the market average returns. We regret to report that long term Grange Resources Limited (ASX:GRR) shareholders have had that experience, with the share price dropping 35% in three years, versus a market return of about 20%. And more recent buyers are having a tough time too, with a drop of 34% in the last year. Shareholders have had an even rougher run lately, with the share price down 18% in the last 90 days.
With the stock having lost 10% in the past week, it's worth taking a look at business performance and seeing if there's any red flags.
Check out our latest analysis for Grange Resources
There is no denying that markets are sometimes efficient, but prices do not always reflect underlying business performance. One imperfect but simple way to consider how the market perception of a company has shifted is to compare the change in the earnings per share (EPS) with the share price movement.
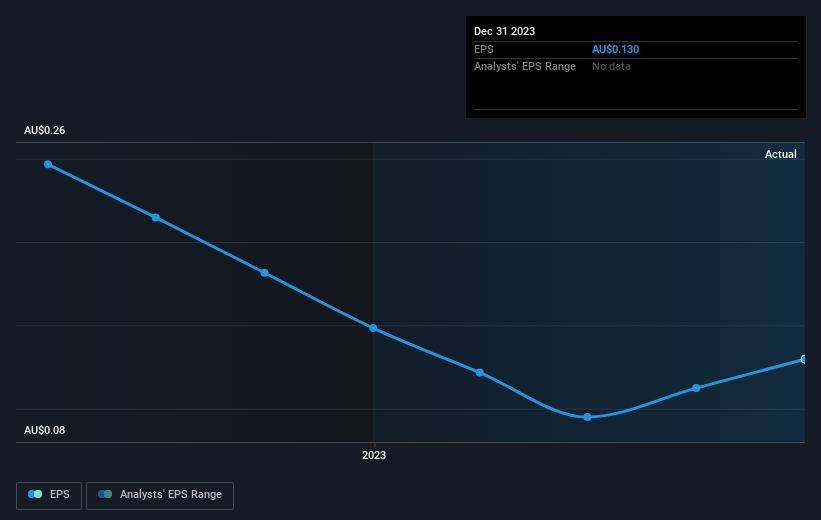
Grange Resources saw its EPS decline at a compound rate of 9.7% per year, over the last three years. The share price decline of 13% is actually steeper than the EPS slippage. So it seems the market was too confident about the business, in the past. The less favorable sentiment is reflected in its current P/E ratio of 2.66.
You can see how EPS has changed over time in the image below (click on the chart to see the exact values).
It might be well worthwhile taking a look at our free report on Grange Resources' earnings, revenue and cash flow.
What About Dividends?
When looking at investment returns, it is important to consider the difference between total shareholder return (TSR) and share price return. The TSR is a return calculation that accounts for the value of cash dividends (assuming that any dividend received was reinvested) and the calculated value of any discounted capital raisings and spin-offs. It's fair to say that the TSR gives a more complete picture for stocks that pay a dividend. As it happens, Grange Resources' TSR for the last 3 years was -6.7%, which exceeds the share price return mentioned earlier. This is largely a result of its dividend payments!
A Different Perspective
Investors in Grange Resources had a tough year, with a total loss of 31% (including dividends), against a market gain of about 15%. Even the share prices of good stocks drop sometimes, but we want to see improvements in the fundamental metrics of a business, before getting too interested. On the bright side, long term shareholders have made money, with a gain of 18% per year over half a decade. It could be that the recent sell-off is an opportunity, so it may be worth checking the fundamental data for signs of a long term growth trend. It's always interesting to track share price performance over the longer term. But to understand Grange Resources better, we need to consider many other factors. Consider for instance, the ever-present spectre of investment risk. We've identified 1 warning sign with Grange Resources , and understanding them should be part of your investment process.
If you would prefer to check out another company -- one with potentially superior financials -- then do not miss this free list of companies that have proven they can grow earnings.
Please note, the market returns quoted in this article reflect the market weighted average returns of stocks that currently trade on Australian exchanges.
New: Manage All Your Stock Portfolios in One Place
We've created the ultimate portfolio companion for stock investors, and it's free.
• Connect an unlimited number of Portfolios and see your total in one currency
• Be alerted to new Warning Signs or Risks via email or mobile
• Track the Fair Value of your stocks
Have feedback on this article? Concerned about the content? Get in touch with us directly. Alternatively, email editorial-team (at) simplywallst.com.
This article by Simply Wall St is general in nature. We provide commentary based on historical data and analyst forecasts only using an unbiased methodology and our articles are not intended to be financial advice. It does not constitute a recommendation to buy or sell any stock, and does not take account of your objectives, or your financial situation. We aim to bring you long-term focused analysis driven by fundamental data. Note that our analysis may not factor in the latest price-sensitive company announcements or qualitative material. Simply Wall St has no position in any stocks mentioned.
About ASX:GRR
Grange Resources
Owns and operates integrated iron ore mining and pellet production business in Australia and internationally.
Flawless balance sheet and good value.
Similar Companies
Market Insights


Advertisement
Community Narratives
A Quality Compounder Marked Down on Overblown Fears
Fair Value US$120.72|60.9% undervalued
BA
Community Contributor

Wyndham Continues Global Expansion with 19% Ancillary Revenue Growth
Fair Value US$105.80|19.7% undervalued
ZW
Community Contributor