- Australia
- /
- Metals and Mining
- /
- ASX:GOR
Calculating The Intrinsic Value Of Gold Road Resources Limited (ASX:GOR)

Key Insights
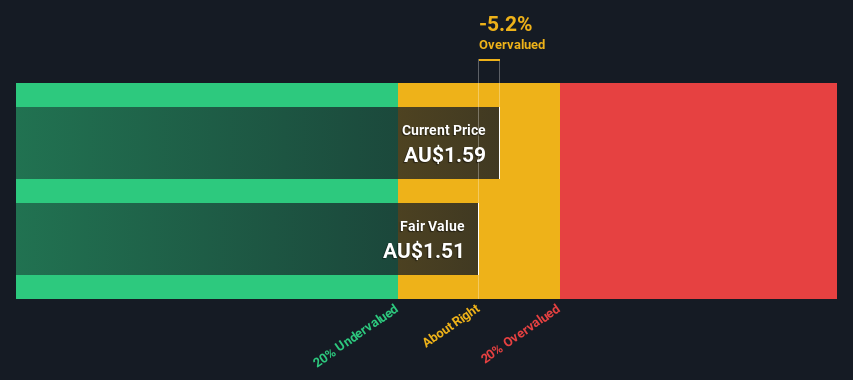
- Using the 2 Stage Free Cash Flow to Equity, Gold Road Resources fair value estimate is AU$1.51
- Current share price of AU$1.59 suggests Gold Road Resources is potentially trading close to its fair value
- Our fair value estimate is 20% lower than Gold Road Resources' analyst price target of AU$1.88
Today we'll do a simple run through of a valuation method used to estimate the attractiveness of Gold Road Resources Limited (ASX:GOR) as an investment opportunity by taking the expected future cash flows and discounting them to their present value. Our analysis will employ the Discounted Cash Flow (DCF) model. It may sound complicated, but actually it is quite simple!
We would caution that there are many ways of valuing a company and, like the DCF, each technique has advantages and disadvantages in certain scenarios. If you want to learn more about discounted cash flow, the rationale behind this calculation can be read in detail in the Simply Wall St analysis model.
Check out our latest analysis for Gold Road Resources
What's The Estimated Valuation?
We're using the 2-stage growth model, which simply means we take in account two stages of company's growth. In the initial period the company may have a higher growth rate and the second stage is usually assumed to have a stable growth rate. To start off with, we need to estimate the next ten years of cash flows. Where possible we use analyst estimates, but when these aren't available we extrapolate the previous free cash flow (FCF) from the last estimate or reported value. We assume companies with shrinking free cash flow will slow their rate of shrinkage, and that companies with growing free cash flow will see their growth rate slow, over this period. We do this to reflect that growth tends to slow more in the early years than it does in later years.
Generally we assume that a dollar today is more valuable than a dollar in the future, and so the sum of these future cash flows is then discounted to today's value:
10-year free cash flow (FCF) estimate
| 2024 | 2025 | 2026 | 2027 | 2028 | 2029 | 2030 | 2031 | 2032 | 2033 | |
| Levered FCF (A$, Millions) | AU$100.9m | AU$166.5m | AU$172.6m | AU$111.1m | AU$102.2m | AU$97.4m | AU$94.9m | AU$93.8m | AU$93.7m | AU$94.2m |
| Growth Rate Estimate Source | Analyst x6 | Analyst x7 | Analyst x7 | Analyst x1 | Analyst x1 | Est @ -4.69% | Est @ -2.60% | Est @ -1.14% | Est @ -0.12% | Est @ 0.59% |
| Present Value (A$, Millions) Discounted @ 7.7% | AU$93.7 | AU$144 | AU$138 | AU$82.6 | AU$70.6 | AU$62.4 | AU$56.5 | AU$51.8 | AU$48.1 | AU$44.9 |
("Est" = FCF growth rate estimated by Simply Wall St)
Present Value of 10-year Cash Flow (PVCF) = AU$792m
After calculating the present value of future cash flows in the initial 10-year period, we need to calculate the Terminal Value, which accounts for all future cash flows beyond the first stage. For a number of reasons a very conservative growth rate is used that cannot exceed that of a country's GDP growth. In this case we have used the 5-year average of the 10-year government bond yield (2.3%) to estimate future growth. In the same way as with the 10-year 'growth' period, we discount future cash flows to today's value, using a cost of equity of 7.7%.
Terminal Value (TV)= FCF2033 × (1 + g) ÷ (r – g) = AU$94m× (1 + 2.3%) ÷ (7.7%– 2.3%) = AU$1.8b
Present Value of Terminal Value (PVTV)= TV / (1 + r)10= AU$1.8b÷ ( 1 + 7.7%)10= AU$845m
The total value, or equity value, is then the sum of the present value of the future cash flows, which in this case is AU$1.6b. In the final step we divide the equity value by the number of shares outstanding. Relative to the current share price of AU$1.6, the company appears around fair value at the time of writing. Valuations are imprecise instruments though, rather like a telescope - move a few degrees and end up in a different galaxy. Do keep this in mind.
Important Assumptions
Now the most important inputs to a discounted cash flow are the discount rate, and of course, the actual cash flows. You don't have to agree with these inputs, I recommend redoing the calculations yourself and playing with them. The DCF also does not consider the possible cyclicality of an industry, or a company's future capital requirements, so it does not give a full picture of a company's potential performance. Given that we are looking at Gold Road Resources as potential shareholders, the cost of equity is used as the discount rate, rather than the cost of capital (or weighted average cost of capital, WACC) which accounts for debt. In this calculation we've used 7.7%, which is based on a levered beta of 1.181. Beta is a measure of a stock's volatility, compared to the market as a whole. We get our beta from the industry average beta of globally comparable companies, with an imposed limit between 0.8 and 2.0, which is a reasonable range for a stable business.
SWOT Analysis for Gold Road Resources
- Earnings growth over the past year exceeded the industry.
- Currently debt free.
- Dividend is low compared to the top 25% of dividend payers in the Metals and Mining market.
- Expensive based on P/E ratio and estimated fair value.
- Annual earnings are forecast to grow for the next 3 years.
- Annual earnings are forecast to grow slower than the Australian market.
Moving On:
Valuation is only one side of the coin in terms of building your investment thesis, and it is only one of many factors that you need to assess for a company. The DCF model is not a perfect stock valuation tool. Preferably you'd apply different cases and assumptions and see how they would impact the company's valuation. If a company grows at a different rate, or if its cost of equity or risk free rate changes sharply, the output can look very different. For Gold Road Resources, there are three relevant elements you should explore:
- Financial Health: Does GOR have a healthy balance sheet? Take a look at our free balance sheet analysis with six simple checks on key factors like leverage and risk.
- Future Earnings: How does GOR's growth rate compare to its peers and the wider market? Dig deeper into the analyst consensus number for the upcoming years by interacting with our free analyst growth expectation chart.
- Other High Quality Alternatives: Do you like a good all-rounder? Explore our interactive list of high quality stocks to get an idea of what else is out there you may be missing!
PS. The Simply Wall St app conducts a discounted cash flow valuation for every stock on the ASX every day. If you want to find the calculation for other stocks just search here.
The New Payments ETF Is Live on NASDAQ:
Money is moving to real-time rails, and a newly listed ETF now gives investors direct exposure. Fast settlement. Institutional custody. Simple access.
Explore how this launch could reshape portfolios
Sponsored ContentNew: Manage All Your Stock Portfolios in One Place
We've created the ultimate portfolio companion for stock investors, and it's free.
• Connect an unlimited number of Portfolios and see your total in one currency
• Be alerted to new Warning Signs or Risks via email or mobile
• Track the Fair Value of your stocks
Have feedback on this article? Concerned about the content? Get in touch with us directly. Alternatively, email editorial-team (at) simplywallst.com.
This article by Simply Wall St is general in nature. We provide commentary based on historical data and analyst forecasts only using an unbiased methodology and our articles are not intended to be financial advice. It does not constitute a recommendation to buy or sell any stock, and does not take account of your objectives, or your financial situation. We aim to bring you long-term focused analysis driven by fundamental data. Note that our analysis may not factor in the latest price-sensitive company announcements or qualitative material. Simply Wall St has no position in any stocks mentioned.
About ASX:GOR
Gold Road Resources
Engages in the exploration of gold properties in Australia.
Undervalued with solid track record.
Similar Companies
Market Insights

Weekly Picks

Early mover in a fast growing industry. Likely to experience share price volatility as they scale


A case for CA$31.80 (undiluted), aka 8,616% upside from CA$0.37 (an 86 bagger!).


Moderation and Stabilisation: HOLD: Fair Price based on a 4-year Cycle is $12.08
Recently Updated Narratives

Airbnb Stock: Platform Growth in a World of Saturation and Scrutiny

Adobe Stock: AI-Fueled ARR Growth Pushes Guidance Higher, But Cost Pressures Loom

Thomson Reuters Stock: When Legal Intelligence Becomes Mission-Critical Infrastructure
Popular Narratives


Crazy Undervalued 42 Baggers Silver Play (Active & Running Mine)


NVDA: Expanding AI Demand Will Drive Major Data Center Investments Through 2026

The AI Infrastructure Giant Grows Into Its Valuation
Trending Discussion


