- Australia
- /
- Metals and Mining
- /
- ASX:FMG
Fortescue's (ASX:FMG) earnings growth rate lags the 37% CAGR delivered to shareholders

It hasn't been the best quarter for Fortescue Ltd (ASX:FMG) shareholders, since the share price has fallen 21% in that time. But that doesn't change the fact that the returns over the last five years have been very strong. In fact, the share price is 166% higher today. To some, the recent pullback wouldn't be surprising after such a fast rise. The more important question is whether the stock is too cheap or too expensive today.
While this past week has detracted from the company's five-year return, let's look at the recent trends of the underlying business and see if the gains have been in alignment.
View our latest analysis for Fortescue
To paraphrase Benjamin Graham: Over the short term the market is a voting machine, but over the long term it's a weighing machine. One way to examine how market sentiment has changed over time is to look at the interaction between a company's share price and its earnings per share (EPS).
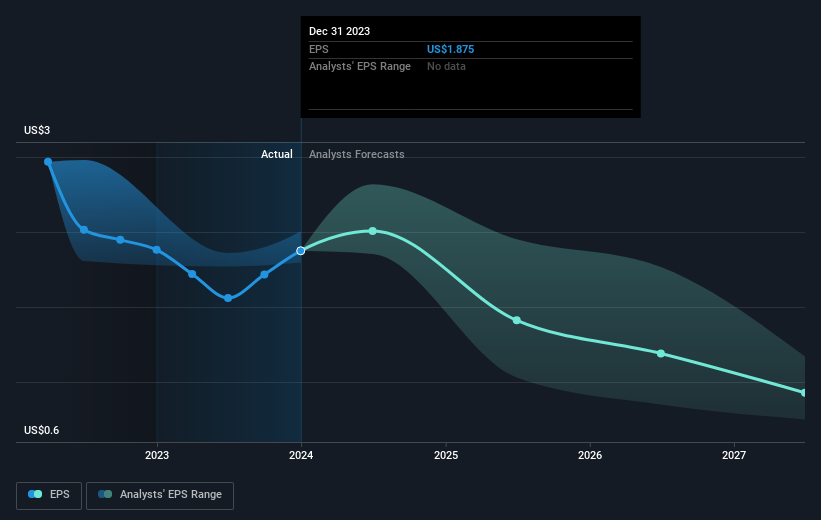
Over half a decade, Fortescue managed to grow its earnings per share at 47% a year. This EPS growth is higher than the 22% average annual increase in the share price. Therefore, it seems the market has become relatively pessimistic about the company. The reasonably low P/E ratio of 7.11 also suggests market apprehension.
The graphic below depicts how EPS has changed over time (unveil the exact values by clicking on the image).
We like that insiders have been buying shares in the last twelve months. Having said that, most people consider earnings and revenue growth trends to be a more meaningful guide to the business. It might be well worthwhile taking a look at our free report on Fortescue's earnings, revenue and cash flow.
What About Dividends?
It is important to consider the total shareholder return, as well as the share price return, for any given stock. The TSR incorporates the value of any spin-offs or discounted capital raisings, along with any dividends, based on the assumption that the dividends are reinvested. Arguably, the TSR gives a more comprehensive picture of the return generated by a stock. In the case of Fortescue, it has a TSR of 375% for the last 5 years. That exceeds its share price return that we previously mentioned. The dividends paid by the company have thusly boosted the total shareholder return.
A Different Perspective
Fortescue provided a TSR of 2.8% over the last twelve months. But that return falls short of the market. It's probably a good sign that the company has an even better long term track record, having provided shareholders with an annual TSR of 37% over five years. It's quite possible the business continues to execute with prowess, even as the share price gains are slowing. It's always interesting to track share price performance over the longer term. But to understand Fortescue better, we need to consider many other factors. To that end, you should learn about the 2 warning signs we've spotted with Fortescue (including 1 which is significant) .
If you like to buy stocks alongside management, then you might just love this free list of companies. (Hint: most of them are flying under the radar).
Please note, the market returns quoted in this article reflect the market weighted average returns of stocks that currently trade on Australian exchanges.
New: AI Stock Screener & Alerts
Our new AI Stock Screener scans the market every day to uncover opportunities.
• Dividend Powerhouses (3%+ Yield)
• Undervalued Small Caps with Insider Buying
• High growth Tech and AI Companies
Or build your own from over 50 metrics.
Have feedback on this article? Concerned about the content? Get in touch with us directly. Alternatively, email editorial-team (at) simplywallst.com.
This article by Simply Wall St is general in nature. We provide commentary based on historical data and analyst forecasts only using an unbiased methodology and our articles are not intended to be financial advice. It does not constitute a recommendation to buy or sell any stock, and does not take account of your objectives, or your financial situation. We aim to bring you long-term focused analysis driven by fundamental data. Note that our analysis may not factor in the latest price-sensitive company announcements or qualitative material. Simply Wall St has no position in any stocks mentioned.
Have feedback on this article? Concerned about the content? Get in touch with us directly. Alternatively, email editorial-team@simplywallst.com
About ASX:FMG
Fortescue
Engages in the exploration, development, production, processing, and sale of iron ore in Australia, China, and internationally.
Outstanding track record, undervalued and pays a dividend.

