Advertisement
- Australia
- /
- Consumer Finance
- /
- ASX:PLT
ASX Penny Stocks To Watch In May 2025

Simply Wall St
Reviewed by Simply Wall St

The ASX200 is set to open slightly lower, reflecting a cautious sentiment despite strong gains on Wall Street, driven by robust Big Tech earnings. Penny stocks, while often considered a niche segment of the market, continue to offer intriguing opportunities for investors seeking growth at accessible price points. These smaller or newer companies can present significant potential when backed by sound financial health and fundamentals.
Top 10 Penny Stocks In Australia
| Name | Share Price | Market Cap | Rewards & Risks |
| CTI Logistics (ASX:CLX) | A$1.695 | A$136.52M | ✅ 4 ⚠️ 2 View Analysis > |
| Accent Group (ASX:AX1) | A$1.885 | A$1.07B | ✅ 4 ⚠️ 2 View Analysis > |
| EZZ Life Science Holdings (ASX:EZZ) | A$1.405 | A$66.28M | ✅ 4 ⚠️ 2 View Analysis > |
| IVE Group (ASX:IGL) | A$2.62 | A$403.96M | ✅ 4 ⚠️ 2 View Analysis > |
| GTN (ASX:GTN) | A$0.60 | A$115.38M | ✅ 3 ⚠️ 2 View Analysis > |
| West African Resources (ASX:WAF) | A$2.32 | A$2.64B | ✅ 4 ⚠️ 1 View Analysis > |
| Bisalloy Steel Group (ASX:BIS) | A$3.30 | A$156.59M | ✅ 3 ⚠️ 1 View Analysis > |
| Regal Partners (ASX:RPL) | A$2.06 | A$692.5M | ✅ 4 ⚠️ 3 View Analysis > |
| Navigator Global Investments (ASX:NGI) | A$1.65 | A$808.63M | ✅ 5 ⚠️ 3 View Analysis > |
| NRW Holdings (ASX:NWH) | A$2.73 | A$1.25B | ✅ 5 ⚠️ 1 View Analysis > |
Click here to see the full list of 988 stocks from our ASX Penny Stocks screener.
We're going to check out a few of the best picks from our screener tool.
88 Energy (ASX:88E)
Simply Wall St Financial Health Rating: ★★★★☆☆
Overview: 88 Energy Limited is involved in the exploration and production of oil and gas properties in the United States and Namibia, with a market cap of A$43.40 million.
Operations: 88 Energy Limited currently does not report any specific revenue segments.
Market Cap: A$43.4M
88 Energy Limited, with a market cap of A$43.40 million, is pre-revenue and currently unprofitable, having reported a net loss of A$32.82 million for 2024. Despite being debt-free and having experienced management and board teams, the company has less than a year of cash runway based on current free cash flow trends. The stock has shown high volatility recently and was dropped from the S&P/ASX Emerging Companies Index in March 2025. Short-term assets comfortably cover liabilities, yet its negative return on equity reflects ongoing financial challenges ahead of its upcoming earnings release on May 5, 2025.
- Jump into the full analysis health report here for a deeper understanding of 88 Energy.
- Explore historical data to track 88 Energy's performance over time in our past results report.
Emerald Resources (ASX:EMR)
Simply Wall St Financial Health Rating: ★★★★★☆
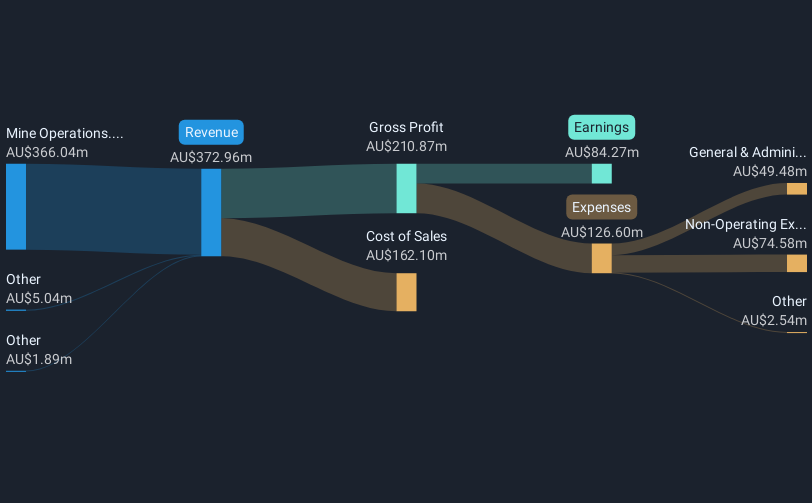
Overview: Emerald Resources NL focuses on the exploration and development of mineral reserves in Cambodia and Australia, with a market cap of A$2.71 billion.
Operations: The company generates revenue primarily from its Mine Operations segment, which accounts for A$427.32 million.
Market Cap: A$2.71B
Emerald Resources NL, with a market cap of A$2.71 billion, has demonstrated robust financial health and growth. The company reported half-year sales of A$239.73 million, up from A$176.75 million the previous year, and net income increased to A$59.67 million from A$43.31 million. Its earnings have grown significantly over the past five years at an average rate of 60.9% per year, though recent growth has slowed to 32.2%. Emerald's debt is well covered by operating cash flow and its short-term assets exceed both short-term and long-term liabilities, highlighting strong liquidity management in the mining sector.
- Dive into the specifics of Emerald Resources here with our thorough balance sheet health report.
- Explore Emerald Resources' analyst forecasts in our growth report.
Plenti Group (ASX:PLT)
Simply Wall St Financial Health Rating: ★★★★★☆
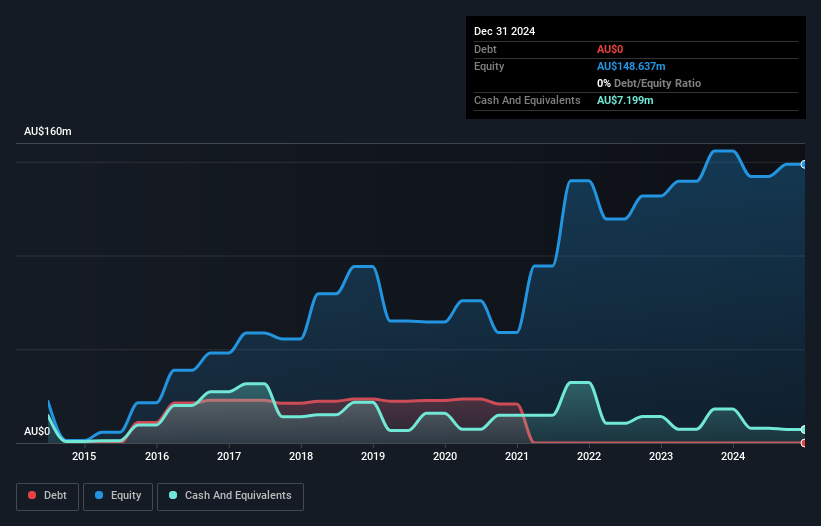
Overview: Plenti Group Limited operates in the fintech lending and investment sector in Australia, with a market capitalization of A$151.81 million.
Operations: The company generates revenue of A$83.84 million from its financial services segment.
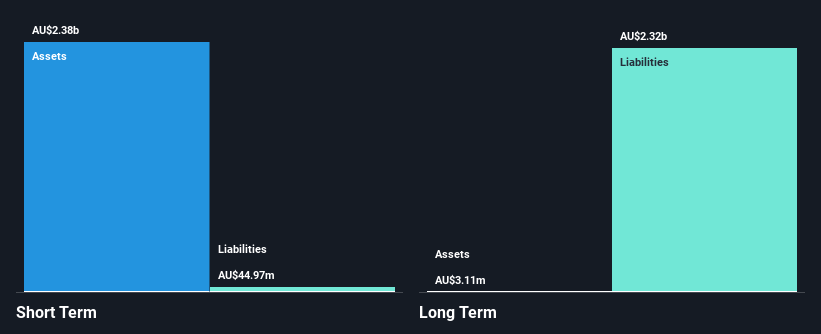
Market Cap: A$151.81M
Plenti Group Limited, with a market cap of A$151.81 million, operates in the fintech sector and is currently unprofitable. Despite this, it has shown positive cash flow growth of 69.2% annually and maintains a sufficient cash runway for over three years. The company's short-term assets (A$2.4 billion) comfortably cover both its short-term (A$45 million) and long-term liabilities (A$2.3 billion). However, Plenti's high net debt to equity ratio of 11,169.4% is concerning despite improvements from previous levels. Earnings are forecasted to grow significantly at 89.64% per year but remain speculative given current profitability challenges.
- Click to explore a detailed breakdown of our findings in Plenti Group's financial health report.
- Gain insights into Plenti Group's outlook and expected performance with our report on the company's earnings estimates.
Where To Now?
- Dive into all 988 of the ASX Penny Stocks we have identified here.
- Curious About Other Options? Rare earth metals are an input to most high-tech devices, military and defence systems and electric vehicles. The global race is on to secure supply of these critical minerals. Beat the pack to uncover the 23 best rare earth metal stocks of the very few that mine this essential strategic resource.
This article by Simply Wall St is general in nature. We provide commentary based on historical data and analyst forecasts only using an unbiased methodology and our articles are not intended to be financial advice. It does not constitute a recommendation to buy or sell any stock, and does not take account of your objectives, or your financial situation. We aim to bring you long-term focused analysis driven by fundamental data. Note that our analysis may not factor in the latest price-sensitive company announcements or qualitative material. Simply Wall St has no position in any stocks mentioned.
New: Manage All Your Stock Portfolios in One Place
We've created the ultimate portfolio companion for stock investors, and it's free.
• Connect an unlimited number of Portfolios and see your total in one currency
• Be alerted to new Warning Signs or Risks via email or mobile
• Track the Fair Value of your stocks
Have feedback on this article? Concerned about the content? Get in touch with us directly. Alternatively, email editorial-team@simplywallst.com
About ASX:PLT
Plenti Group
Engages in the fintech lending and investment business in Australia.
Reasonable growth potential and fair value.
Similar Companies
Market Insights


Advertisement
Community Narratives
A Quality Compounder Marked Down on Overblown Fears
Fair Value US$120.72|62.4% undervalued
BA
Community Contributor

Wyndham Continues Global Expansion with 19% Ancillary Revenue Growth
Fair Value US$105.80|19.2% undervalued
ZW
Community Contributor