- Australia
- /
- Metals and Mining
- /
- ASX:BSL
Optimism for BlueScope Steel (ASX:BSL) has grown this past week, despite five-year decline in earnings


BlueScope Steel Limited (ASX:BSL) shareholders might be concerned after seeing the share price drop 11% in the last quarter. Looking further back, the stock has generated good profits over five years. After all, the share price is up a market-beating 63% in that time.
Since it's been a strong week for BlueScope Steel shareholders, let's have a look at trend of the longer term fundamentals.
See our latest analysis for BlueScope Steel
To quote Buffett, 'Ships will sail around the world but the Flat Earth Society will flourish. There will continue to be wide discrepancies between price and value in the marketplace...' By comparing earnings per share (EPS) and share price changes over time, we can get a feel for how investor attitudes to a company have morphed over time.
BlueScope Steel's earnings per share are down 9.9% per year, despite strong share price performance over five years.
This means it's unlikely the market is judging the company based on earnings growth. Because earnings per share don't seem to match up with the share price, we'll take a look at other metrics instead.
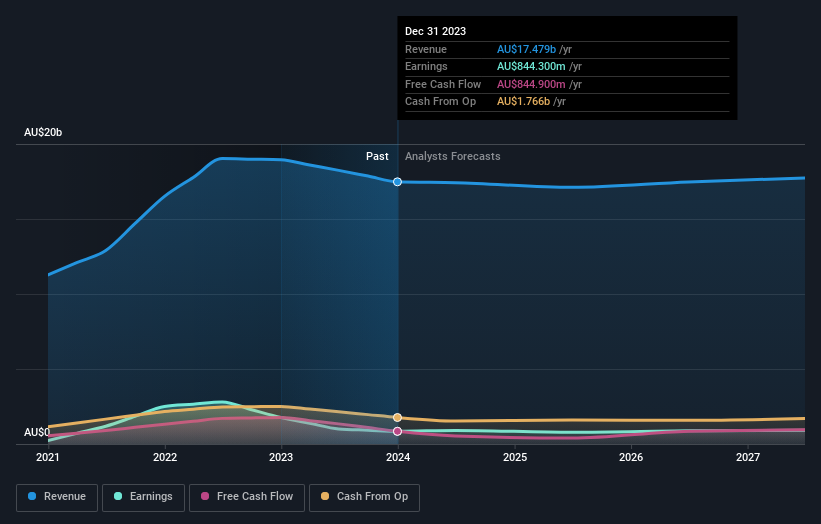
In contrast revenue growth of 12% per year is probably viewed as evidence that BlueScope Steel is growing, a real positive. It's quite possible that management are prioritizing revenue growth over EPS growth at the moment.
The graphic below depicts how earnings and revenue have changed over time (unveil the exact values by clicking on the image).
We consider it positive that insiders have made significant purchases in the last year. Even so, future earnings will be far more important to whether current shareholders make money. If you are thinking of buying or selling BlueScope Steel stock, you should check out this free report showing analyst profit forecasts.
What About Dividends?
When looking at investment returns, it is important to consider the difference between total shareholder return (TSR) and share price return. Whereas the share price return only reflects the change in the share price, the TSR includes the value of dividends (assuming they were reinvested) and the benefit of any discounted capital raising or spin-off. So for companies that pay a generous dividend, the TSR is often a lot higher than the share price return. We note that for BlueScope Steel the TSR over the last 5 years was 81%, which is better than the share price return mentioned above. And there's no prize for guessing that the dividend payments largely explain the divergence!
A Different Perspective
BlueScope Steel shareholders gained a total return of 6.4% during the year. Unfortunately this falls short of the market return. On the bright side, the longer term returns (running at about 13% a year, over half a decade) look better. It's quite possible the business continues to execute with prowess, even as the share price gains are slowing. It's always interesting to track share price performance over the longer term. But to understand BlueScope Steel better, we need to consider many other factors. To that end, you should be aware of the 1 warning sign we've spotted with BlueScope Steel .
If you like to buy stocks alongside management, then you might just love this free list of companies. (Hint: most of them are flying under the radar).
Please note, the market returns quoted in this article reflect the market weighted average returns of stocks that currently trade on Australian exchanges.
Valuation is complex, but we're here to simplify it.
Discover if BlueScope Steel might be undervalued or overvalued with our detailed analysis, featuring fair value estimates, potential risks, dividends, insider trades, and its financial condition.
Access Free AnalysisHave feedback on this article? Concerned about the content? Get in touch with us directly. Alternatively, email editorial-team (at) simplywallst.com.
This article by Simply Wall St is general in nature. We provide commentary based on historical data and analyst forecasts only using an unbiased methodology and our articles are not intended to be financial advice. It does not constitute a recommendation to buy or sell any stock, and does not take account of your objectives, or your financial situation. We aim to bring you long-term focused analysis driven by fundamental data. Note that our analysis may not factor in the latest price-sensitive company announcements or qualitative material. Simply Wall St has no position in any stocks mentioned.
Have feedback on this article? Concerned about the content? Get in touch with us directly. Alternatively, email editorial-team@simplywallst.com
About ASX:BSL
BlueScope Steel
Engages in the production and marketing of metal coated and painted steel building products in Australia, New Zealand, Asia, North America, and internationally.
Flawless balance sheet, good value and pays a dividend.

