
Advertisement
- Australia
- /
- Basic Materials
- /
- ASX:ABC
How Does Adelaide Brighton's (ASX:ABC) P/E Compare To Its Industry, After The Share Price Drop?
To the annoyance of some shareholders, Adelaide Brighton (ASX:ABC) shares are down a considerable 30% in the last month. Indeed the recent decline has arguably caused some bitterness for shareholders who have held through the 52% drop over twelve months.
Assuming nothing else has changed, a lower share price makes a stock more attractive to potential buyers. While the market sentiment towards a stock is very changeable, in the long run, the share price will tend to move in the same direction as earnings per share. The implication here is that long term investors have an opportunity when expectations of a company are too low. Perhaps the simplest way to get a read on investors' expectations of a business is to look at its Price to Earnings Ratio (PE Ratio). A high P/E implies that investors have high expectations of what a company can achieve compared to a company with a low P/E ratio.
See our latest analysis for Adelaide Brighton
Does Adelaide Brighton Have A Relatively High Or Low P/E For Its Industry?
We can tell from its P/E ratio of 10.6 that sentiment around Adelaide Brighton isn't particularly high. The image below shows that Adelaide Brighton has a lower P/E than the average (14.6) P/E for companies in the basic materials industry.
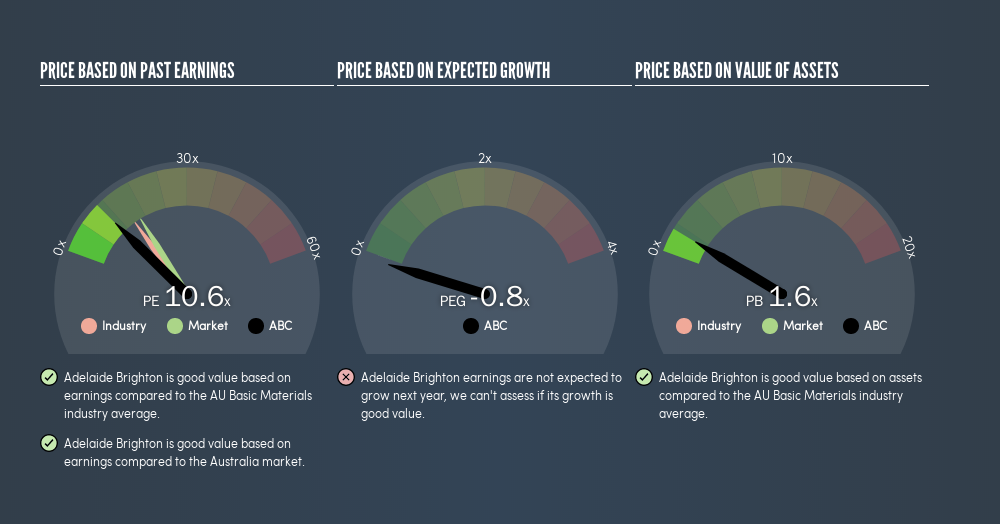
Its relatively low P/E ratio indicates that Adelaide Brighton shareholders think it will struggle to do as well as other companies in its industry classification.
How Growth Rates Impact P/E Ratios
When earnings fall, the 'E' decreases, over time. Therefore, even if you pay a low multiple of earnings now, that multiple will become higher in the future. A higher P/E should indicate the stock is expensive relative to others -- and that may encourage shareholders to sell.
Adelaide Brighton had pretty flat EPS growth in the last year. But EPS is up 3.8% over the last 5 years. And over the longer term (3 years) earnings per share have decreased 3.9% annually. So you wouldn't expect a very high P/E.
Remember: P/E Ratios Don't Consider The Balance Sheet
It's important to note that the P/E ratio considers the market capitalization, not the enterprise value. So it won't reflect the advantage of cash, or disadvantage of debt. The exact same company would hypothetically deserve a higher P/E ratio if it had a strong balance sheet, than if it had a weak one with lots of debt, because a cashed up company can spend on growth.
Spending on growth might be good or bad a few years later, but the point is that the P/E ratio does not account for the option (or lack thereof).
Adelaide Brighton's Balance Sheet
Adelaide Brighton's net debt is 12% of its market cap. That's enough debt to impact the P/E ratio a little; so keep it in mind if you're comparing it to companies without debt.
The Verdict On Adelaide Brighton's P/E Ratio
Adelaide Brighton has a P/E of 10.6. That's below the average in the AU market, which is 16.4. The company hasn't stretched its balance sheet, and earnings are improving. If growth is sustainable over the long term, then the current P/E ratio may be a sign of good value. What can be absolutely certain is that the market has become less optimistic about Adelaide Brighton over the last month, with the P/E ratio falling from 15.2 back then to 10.6 today. For those who prefer to invest with the flow of momentum, that might be a bad sign, but for a contrarian, it may signal opportunity.
Investors have an opportunity when market expectations about a stock are wrong. If the reality for a company is not as bad as the P/E ratio indicates, then the share price should increase as the market realizes this. So this free visual report on analyst forecasts could hold the key to an excellent investment decision.
You might be able to find a better buy than Adelaide Brighton. If you want a selection of possible winners, check out this free list of interesting companies that trade on a P/E below 20 (but have proven they can grow earnings).
We aim to bring you long-term focused research analysis driven by fundamental data. Note that our analysis may not factor in the latest price-sensitive company announcements or qualitative material.
If you spot an error that warrants correction, please contact the editor at editorial-team@simplywallst.com. This article by Simply Wall St is general in nature. It does not constitute a recommendation to buy or sell any stock, and does not take account of your objectives, or your financial situation. Simply Wall St has no position in the stocks mentioned. Thank you for reading.
About ASX:ABC
Mediocre balance sheet and overvalued.
Similar Companies
Market Insights


Advertisement
Community Narratives
A case for TSXV:USA to reach USD $5.00 - $9.00 (CAD $7.30–$12.29) by 2029.
Fair Value CA$12.29|91.2% undervalued
AG
Community Contributor
DLocal's Future Growth Fueled by 35% Revenue and Profit Margin Boosts
Fair Value US$195.39|94.1% undervalued
WY
Community Contributor
Historically Cheap, but the Margin of Safety Is Still Thin
Fair Value SEK 232.58|13.2% undervalued
MA
Community Contributor