
Advertisement
The Australian market has faced a challenging week, with the ASX200 slipping into negative territory amid a cautious mood influenced by economic concerns both locally and from the US. As investors navigate these turbulent times, dividend stocks can offer some stability and income potential, making them an attractive option for those seeking to balance risk in their portfolios.
Top 10 Dividend Stocks In Australia
| Name | Dividend Yield | Dividend Rating |
| Treasury Wine Estates (ASX:TWE) | 6.87% | ★★★★★☆ |
| Super Retail Group (ASX:SUL) | 6.07% | ★★★★★☆ |
| Sugar Terminals (NSX:SUG) | 7.94% | ★★★★★☆ |
| Steadfast Group (ASX:SDF) | 3.71% | ★★★★★☆ |
| Smartgroup (ASX:SIQ) | 6.21% | ★★★★★☆ |
| MFF Capital Investments (ASX:MFF) | 3.85% | ★★★★★☆ |
| Lindsay Australia (ASX:LAU) | 6.39% | ★★★★★☆ |
| Kina Securities (ASX:KSL) | 7.76% | ★★★★★☆ |
| Fiducian Group (ASX:FID) | 4.19% | ★★★★★☆ |
| Accent Group (ASX:AX1) | 5.71% | ★★★★★☆ |
Click here to see the full list of 29 stocks from our Top ASX Dividend Stocks screener.
Let's review some notable picks from our screened stocks.
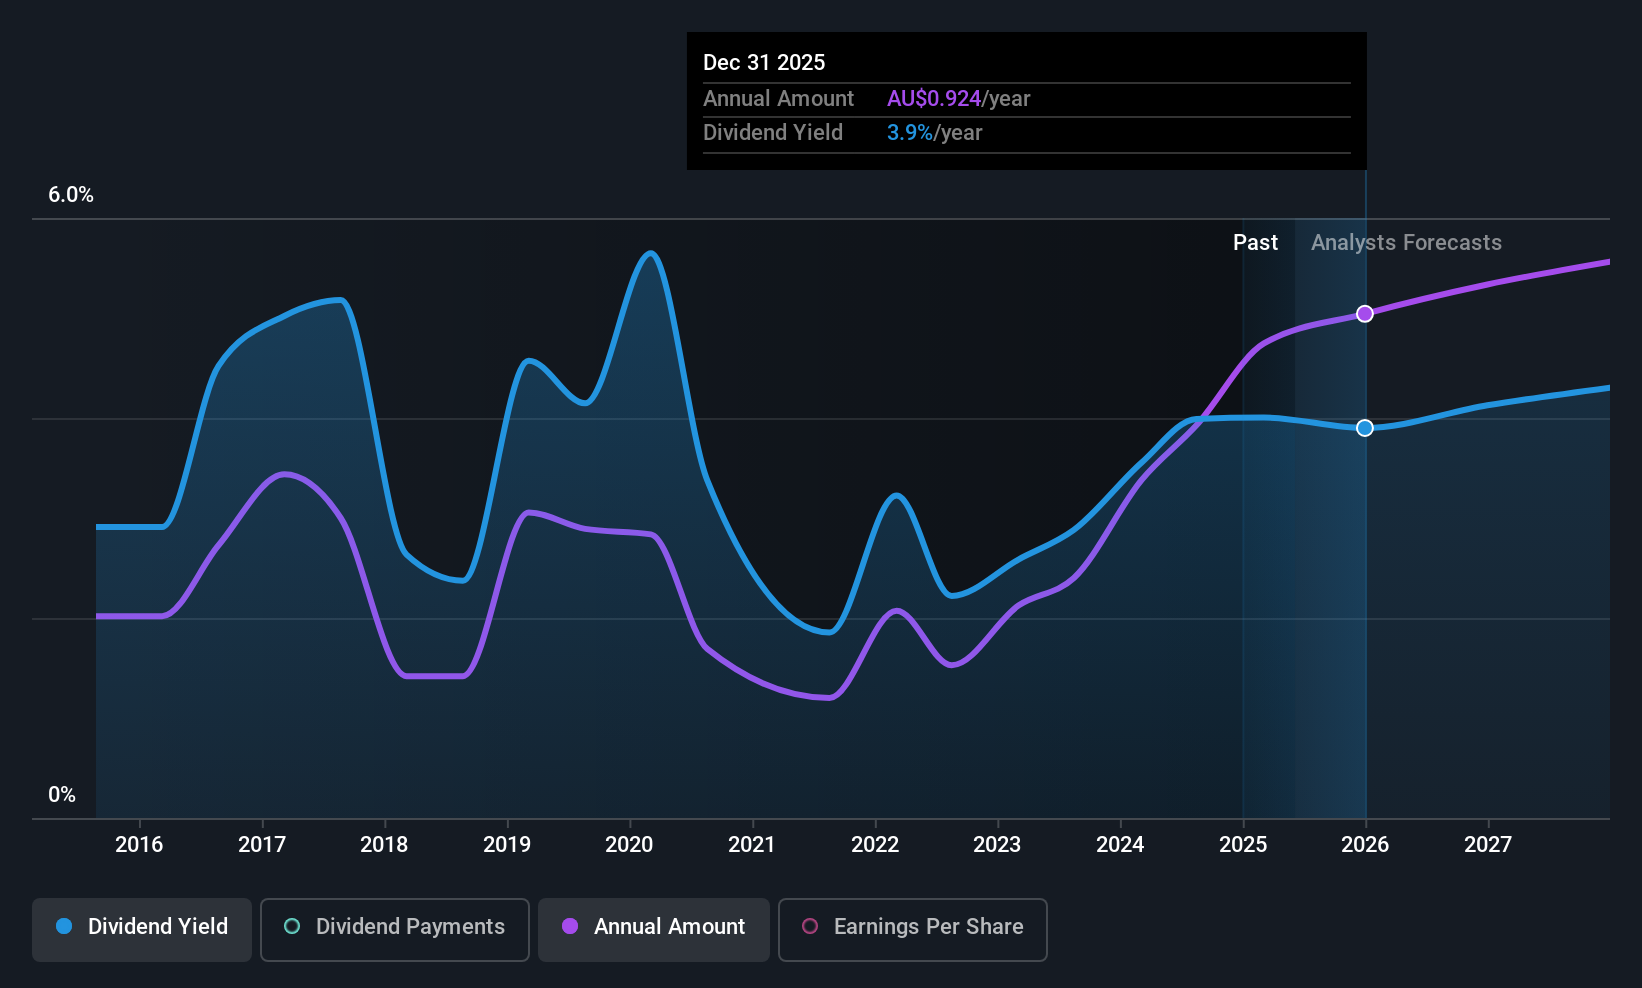
Macquarie Group (ASX:MQG)
Simply Wall St Dividend Rating: ★★★★☆☆
Overview: Macquarie Group Limited is a global financial services provider operating across Australia, New Zealand, the Americas, Europe, the Middle East, Africa, and Asia with a market cap of A$78.92 billion.
Operations: Macquarie Group Limited generates revenue from several segments including Corporate (A$1.10 billion), Macquarie Capital (A$2.64 billion), Macquarie Asset Management (A$4.22 billion), Banking and Financial Services (A$3.24 billion), and Commodities and Global Markets (A$6.02 billion).
Dividend Yield: 3%
Macquarie Group's dividend payments are covered by earnings with a payout ratio of 66.4%, and this is expected to remain stable at 65.9% in three years, suggesting sustainability. However, its dividends have been volatile over the past decade and yield lower than the top quartile of Australian dividend payers. Recent M&A rumors involving a potential break-up of its A$2.5 billion Paraway Pastoral Company could impact future cash flows and investor sentiment regarding dividends.
- Click here to discover the nuances of Macquarie Group with our detailed analytical dividend report.
- Our valuation report here indicates Macquarie Group may be overvalued.

QBE Insurance Group (ASX:QBE)
Simply Wall St Dividend Rating: ★★★★☆☆
Overview: QBE Insurance Group Limited is involved in underwriting general insurance and reinsurance risks across the Australia Pacific, North America, and other international markets, with a market cap of approximately A$29.42 billion.
Operations: QBE Insurance Group Limited's revenue is primarily derived from its International segment ($10.08 billion), North America ($7.76 billion), and Australia Pacific ($5.83 billion).
Dividend Yield: 4.1%
QBE Insurance Group's dividend payments are well-covered by earnings and cash flows, with payout ratios of 44.9% and 26.3%, respectively. Despite this coverage, its dividend history has been volatile over the past decade, impacting reliability. Recent debt financing activities, including a US$300 million subordinated notes issue for Tier 2 capital, reflect ongoing capital management efforts but may influence future financial flexibility and investor perception of dividend stability.
- Click here and access our complete dividend analysis report to understand the dynamics of QBE Insurance Group.
- Our valuation report unveils the possibility QBE Insurance Group's shares may be trading at a discount.
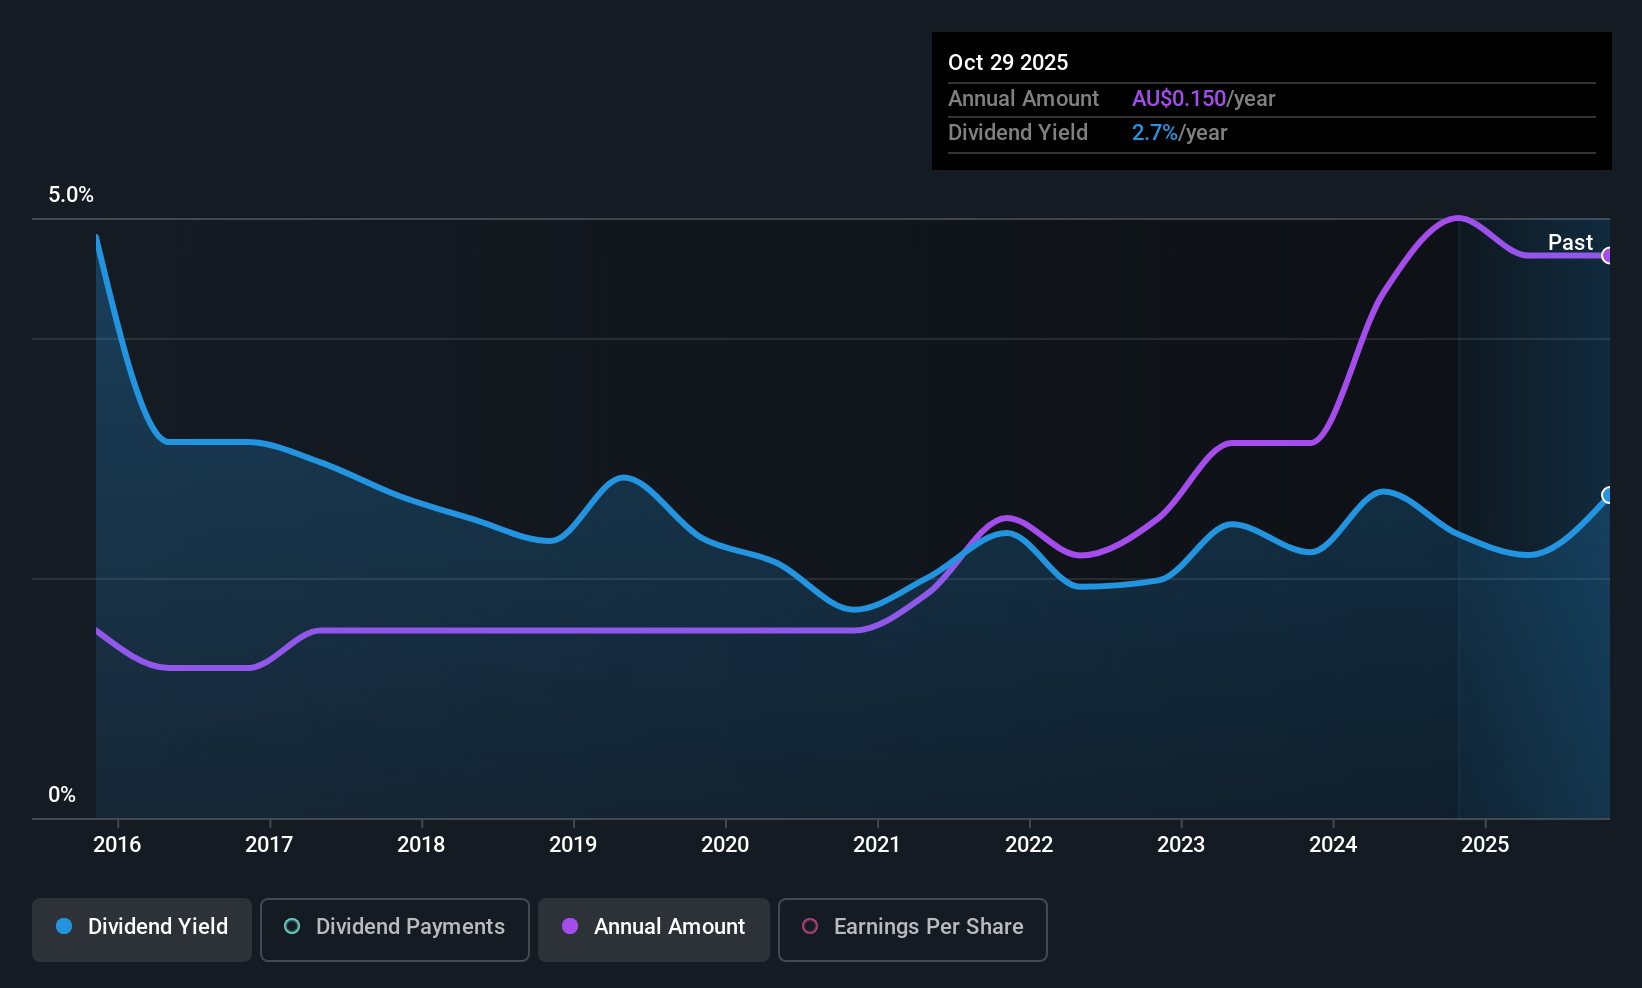
Waterco (ASX:WAT)
Simply Wall St Dividend Rating: ★★★★☆☆
Overview: Waterco Limited manufactures, wholesales, and exports equipment and accessories for swimming pools, spa pools, spa baths, rural pumps, irrigation, and water treatment sectors across Australia, New Zealand, Asia, North America, and Europe with a market cap of A$174.06 million.
Operations: Waterco Limited generates revenue primarily from its Building Products segment, amounting to A$254.93 million.
Dividend Yield: 3%
Waterco Limited's dividend payments, while covered by earnings and cash flows with payout ratios of 55.1% and 29.1%, respectively, have been historically volatile over the past decade. The recent announcement of a A$0.08 dividend for the year ended June 30, 2025, underscores its commitment to shareholder returns despite declining net income from A$13.91 million to A$9.57 million year-on-year, reflecting challenges in maintaining stable profit margins and consistent dividend growth.
- Take a closer look at Waterco's potential here in our dividend report.
- Our valuation report here indicates Waterco may be undervalued.
Where To Now?
- Click here to access our complete index of 29 Top ASX Dividend Stocks.
- Are you invested in these stocks already? Keep abreast of every twist and turn by setting up a portfolio with Simply Wall St, where we make it simple for investors like you to stay informed and proactive.
- Invest smarter with the free Simply Wall St app providing detailed insights into every stock market around the globe.
Curious About Other Options?
- Explore high-performing small cap companies that haven't yet garnered significant analyst attention.
- Fuel your portfolio with companies showing strong growth potential, backed by optimistic outlooks both from analysts and management.
- Find companies with promising cash flow potential yet trading below their fair value.
This article by Simply Wall St is general in nature. We provide commentary based on historical data and analyst forecasts only using an unbiased methodology and our articles are not intended to be financial advice. It does not constitute a recommendation to buy or sell any stock, and does not take account of your objectives, or your financial situation. We aim to bring you long-term focused analysis driven by fundamental data. Note that our analysis may not factor in the latest price-sensitive company announcements or qualitative material. Simply Wall St has no position in any stocks mentioned.
Valuation is complex, but we're here to simplify it.
Discover if QBE Insurance Group might be undervalued or overvalued with our detailed analysis, featuring fair value estimates, potential risks, dividends, insider trades, and its financial condition.
Access Free AnalysisHave feedback on this article? Concerned about the content? Get in touch with us directly. Alternatively, email editorial-team@simplywallst.com
About ASX:QBE
QBE Insurance Group
Engages in underwriting general insurance and reinsurance risks in the Australia Pacific, North America, and internationally.
Undervalued with excellent balance sheet and pays a dividend.
Similar Companies
Market Insights

Advertisement
Community Narratives
The company that turned a verb into a global necessity and basically runs the modern internet, digital ads, smartphones, maps, and AI.
Fair Value US$300.00|5.2% undervalued
OS
Community Contributor
Flowers Foods Pays A Fair Price For Health
Fair Value US$16.12|24.9% undervalued
NV
Community Contributor
TMX Group will thrive with 33.3% profit margin and enduring market moat
Fair Value CA$49.90|3.3% overvalued
LI
Community Contributor
The "Molecular Pencil": Why Beam's Technology is Built to Win
Fair Value US$65.01|64.5% undervalued
DA
Community Contributor