- Australia
- /
- Capital Markets
- /
- ASX:BFG
Many Still Looking Away From Bell Financial Group Limited (ASX:BFG)

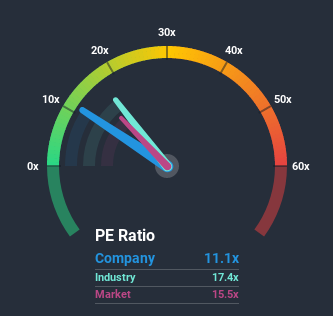
Bell Financial Group Limited's (ASX:BFG) price-to-earnings (or "P/E") ratio of 11.1x might make it look like a buy right now compared to the market in Australia, where around half of the companies have P/E ratios above 16x and even P/E's above 29x are quite common. Nonetheless, we'd need to dig a little deeper to determine if there is a rational basis for the reduced P/E.
The earnings growth achieved at Bell Financial Group over the last year would be more than acceptable for most companies. It might be that many expect the respectable earnings performance to degrade substantially, which has repressed the P/E. If you like the company, you'd be hoping this isn't the case so that you could potentially pick up some stock while it's out of favour.
View our latest analysis for Bell Financial Group
Where Does Bell Financial Group's P/E Sit Within Its Industry?
It's plausible that Bell Financial Group's low P/E ratio could be a result of tendencies within its own industry. You'll notice in the figure below that P/E ratios in the Capital Markets industry are similar to the market. So it appears the company's ratio isn't really influenced by these industry numbers currently. Ordinarily, the majority of companies' P/E's would be supported by the general conditions within the Capital Markets industry. We'd highlight though, the spotlight should be on the anticipated direction of the company's earnings.

How Is Bell Financial Group's Growth Trending?
There's an inherent assumption that a company should underperform the market for P/E ratios like Bell Financial Group's to be considered reasonable.
Retrospectively, the last year delivered an exceptional 22% gain to the company's bottom line. The strong recent performance means it was also able to grow EPS by 64% in total over the last three years. So we can start by confirming that the company has done a great job of growing earnings over that time.
This is in contrast to the rest of the market, which is expected to grow by 1.3% over the next year, materially lower than the company's recent medium-term annualised growth rates.
In light of this, it's peculiar that Bell Financial Group's P/E sits below the majority of other companies. Apparently some shareholders believe the recent performance has exceeded its limits and have been accepting significantly lower selling prices.
What We Can Learn From Bell Financial Group's P/E?
The price-to-earnings ratio's power isn't primarily as a valuation instrument but rather to gauge current investor sentiment and future expectations.
Our examination of Bell Financial Group revealed its three-year earnings trends aren't contributing to its P/E anywhere near as much as we would have predicted, given they look better than current market expectations. There could be some major unobserved threats to earnings preventing the P/E ratio from matching this positive performance. At least price risks look to be very low if recent medium-term earnings trends continue, but investors seem to think future earnings could see a lot of volatility.
You should always think about risks. Case in point, we've spotted 3 warning signs for Bell Financial Group you should be aware of.
If you're unsure about the strength of Bell Financial Group's business, why not explore our interactive list of stocks with solid business fundamentals for some other companies you may have missed.
If you decide to trade Bell Financial Group, use the lowest-cost* platform that is rated #1 Overall by Barron’s, Interactive Brokers. Trade stocks, options, futures, forex, bonds and funds on 135 markets, all from a single integrated account.Promoted
Valuation is complex, but we're here to simplify it.
Discover if Bell Financial Group might be undervalued or overvalued with our detailed analysis, featuring fair value estimates, potential risks, dividends, insider trades, and its financial condition.
Access Free AnalysisThis article by Simply Wall St is general in nature. It does not constitute a recommendation to buy or sell any stock, and does not take account of your objectives, or your financial situation. We aim to bring you long-term focused analysis driven by fundamental data. Note that our analysis may not factor in the latest price-sensitive company announcements or qualitative material. Simply Wall St has no position in any stocks mentioned.
*Interactive Brokers Rated Lowest Cost Broker by StockBrokers.com Annual Online Review 2020
Have feedback on this article? Concerned about the content? Get in touch with us directly. Alternatively, email editorial-team@simplywallst.com.
About ASX:BFG
Bell Financial Group
Engages in the provision of full-service broking, online broking, corporate finance, and financial advisory services to private, institutional, and corporate clients in Australia, the United States, the United Kingdom, Hong Kong, and Kuala Lumpur.
Good value with adequate balance sheet and pays a dividend.
Similar Companies
Market Insights
Community Narratives


