
Advertisement
- Australia
- /
- Capital Markets
- /
- ASX:AFI
Did You Participate In Any Of Australian Foundation Investment's (ASX:AFI) Respectable 39% Return?
The main point of investing for the long term is to make money. But more than that, you probably want to see it rise more than the market average. Unfortunately for shareholders, while the Australian Foundation Investment Company Limited (ASX:AFI) share price is up 13% in the last five years, that's less than the market return. The last year hasn't been great either, with the stock up just 1.7%.
Check out our latest analysis for Australian Foundation Investment
While the efficient markets hypothesis continues to be taught by some, it has been proven that markets are over-reactive dynamic systems, and investors are not always rational. One way to examine how market sentiment has changed over time is to look at the interaction between a company's share price and its earnings per share (EPS).
Australian Foundation Investment's earnings per share are down 6.1% per year, despite strong share price performance over five years.
Since the EPS are down strongly, it seems highly unlikely market participants are looking at EPS to value the company. The falling EPS doesn't correlate with the climbing share price, so it's worth taking a look at other metrics.
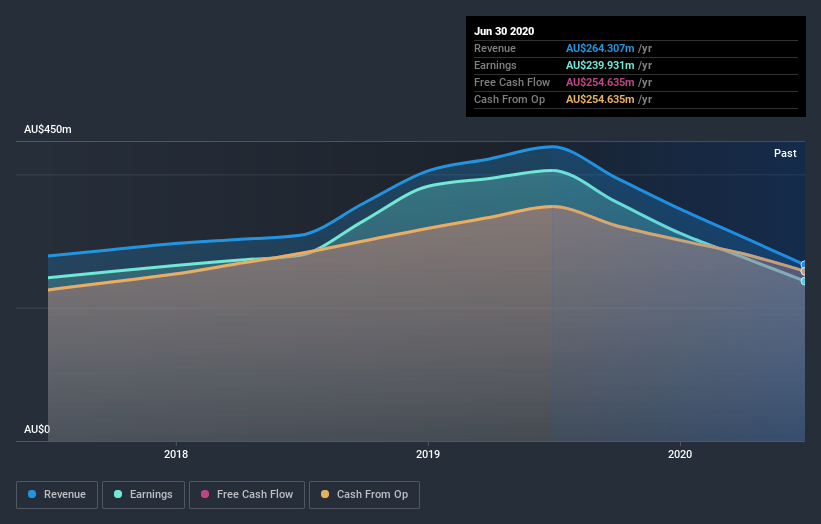
In contrast revenue growth of 3.6% per year is probably viewed as evidence that Australian Foundation Investment is growing, a real positive. It's quite possible that management are prioritizing revenue growth over EPS growth at the moment.
The company's revenue and earnings (over time) are depicted in the image below (click to see the exact numbers).
We consider it positive that insiders have made significant purchases in the last year. Even so, future earnings will be far more important to whether current shareholders make money. Before buying or selling a stock, we always recommend a close examination of historic growth trends, available here..
What About Dividends?
It is important to consider the total shareholder return, as well as the share price return, for any given stock. The TSR is a return calculation that accounts for the value of cash dividends (assuming that any dividend received was reinvested) and the calculated value of any discounted capital raisings and spin-offs. It's fair to say that the TSR gives a more complete picture for stocks that pay a dividend. In the case of Australian Foundation Investment, it has a TSR of 39% for the last 5 years. That exceeds its share price return that we previously mentioned. This is largely a result of its dividend payments!
A Different Perspective
We're pleased to report that Australian Foundation Investment shareholders have received a total shareholder return of 5.4% over one year. That's including the dividend. However, the TSR over five years, coming in at 7% per year, is even more impressive. I find it very interesting to look at share price over the long term as a proxy for business performance. But to truly gain insight, we need to consider other information, too. For example, we've discovered 1 warning sign for Australian Foundation Investment that you should be aware of before investing here.
If you like to buy stocks alongside management, then you might just love this free list of companies. (Hint: insiders have been buying them).
Please note, the market returns quoted in this article reflect the market weighted average returns of stocks that currently trade on AU exchanges.
If you decide to trade Australian Foundation Investment, use the lowest-cost* platform that is rated #1 Overall by Barron’s, Interactive Brokers. Trade stocks, options, futures, forex, bonds and funds on 135 markets, all from a single integrated account. Promoted
New: Manage All Your Stock Portfolios in One Place
We've created the ultimate portfolio companion for stock investors, and it's free.
• Connect an unlimited number of Portfolios and see your total in one currency
• Be alerted to new Warning Signs or Risks via email or mobile
• Track the Fair Value of your stocks
This article by Simply Wall St is general in nature. It does not constitute a recommendation to buy or sell any stock, and does not take account of your objectives, or your financial situation. We aim to bring you long-term focused analysis driven by fundamental data. Note that our analysis may not factor in the latest price-sensitive company announcements or qualitative material. Simply Wall St has no position in any stocks mentioned.
*Interactive Brokers Rated Lowest Cost Broker by StockBrokers.com Annual Online Review 2020
Have feedback on this article? Concerned about the content? Get in touch with us directly. Alternatively, email editorial-team@simplywallst.com.
About ASX:AFI
Adequate balance sheet second-rate dividend payer.
Market Insights

Advertisement
Community Narratives
Finding The True Value Of A Logistics Powerhouse
Fair Value US$95.21|8.4% undervalued
NV
Community Contributor
Paradigm Biopharmaceuticals Will Lead Osteoarthritis Treatment with Zilosul's FDA Success
Fair Value AU$5.50|92.1% undervalued
AM
Community Contributor
Barrick Mining (ABX:CA): A Gold Hedge against a U.S. Shutdown
Fair Value CA$60.00|24.2% undervalued
GM
Community Contributor