
Advertisement
- Australia
- /
- Consumer Services
- /
- ASX:KME
Is The Market Rewarding Kip McGrath Education Centres Limited (ASX:KME) With A Negative Sentiment As A Result Of Its Mixed Fundamentals?

With its stock down 15% over the past month, it is easy to disregard Kip McGrath Education Centres (ASX:KME). We, however decided to study the company's financials to determine if they have got anything to do with the price decline. Fundamentals usually dictate market outcomes so it makes sense to study the company's financials. Specifically, we decided to study Kip McGrath Education Centres' ROE in this article.
Return on Equity or ROE is a test of how effectively a company is growing its value and managing investors’ money. Simply put, it is used to assess the profitability of a company in relation to its equity capital.
Check out our latest analysis for Kip McGrath Education Centres
How Do You Calculate Return On Equity?
The formula for return on equity is:
Return on Equity = Net Profit (from continuing operations) ÷ Shareholders' Equity
So, based on the above formula, the ROE for Kip McGrath Education Centres is:
9.3% = AU$1.8m ÷ AU$20m (Based on the trailing twelve months to December 2021).
The 'return' is the amount earned after tax over the last twelve months. One way to conceptualize this is that for each A$1 of shareholders' capital it has, the company made A$0.09 in profit.
Why Is ROE Important For Earnings Growth?
So far, we've learned that ROE is a measure of a company's profitability. Based on how much of its profits the company chooses to reinvest or "retain", we are then able to evaluate a company's future ability to generate profits. Assuming everything else remains unchanged, the higher the ROE and profit retention, the higher the growth rate of a company compared to companies that don't necessarily bear these characteristics.
A Side By Side comparison of Kip McGrath Education Centres' Earnings Growth And 9.3% ROE
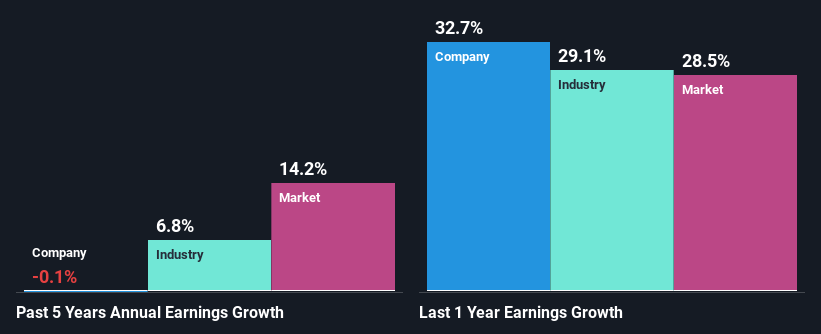
On the face of it, Kip McGrath Education Centres' ROE is not much to talk about. Although a closer study shows that the company's ROE is higher than the industry average of 5.1% which we definitely can't overlook. However, Kip McGrath Education Centres has seen a flattish net income growth over the past five years, which is not saying much. Remember, the company's ROE is a bit low to begin with, just that it is higher than the industry average. So that could be one of the factors that are causing earnings growth to stay flat.
As a next step, we compared Kip McGrath Education Centres' net income growth with the industry and discovered that the industry saw an average growth of 6.8% in the same period.
Earnings growth is a huge factor in stock valuation. What investors need to determine next is if the expected earnings growth, or the lack of it, is already built into the share price. By doing so, they will have an idea if the stock is headed into clear blue waters or if swampy waters await. One good indicator of expected earnings growth is the P/E ratio which determines the price the market is willing to pay for a stock based on its earnings prospects. So, you may want to check if Kip McGrath Education Centres is trading on a high P/E or a low P/E, relative to its industry.
Is Kip McGrath Education Centres Making Efficient Use Of Its Profits?
The high three-year median payout ratio of 60% (meaning, the company retains only 40% of profits) for Kip McGrath Education Centres suggests that the company's earnings growth was miniscule as a result of paying out a majority of its earnings.
Additionally, Kip McGrath Education Centres has paid dividends over a period of seven years, which means that the company's management is determined to pay dividends even if it means little to no earnings growth.
Summary
In total, we're a bit ambivalent about Kip McGrath Education Centres' performance. On the one hand, the company does have a decent rate of return, however, its earnings growth number is quite disappointing and as discussed earlier, the low retained earnings is hampering the growth. Until now, we have only just grazed the surface of the company's past performance by looking at the company's fundamentals. So it may be worth checking this free detailed graph of Kip McGrath Education Centres' past earnings, as well as revenue and cash flows to get a deeper insight into the company's performance.
Valuation is complex, but we're here to simplify it.
Discover if Kip McGrath Education Centres might be undervalued or overvalued with our detailed analysis, featuring fair value estimates, potential risks, dividends, insider trades, and its financial condition.
Access Free AnalysisHave feedback on this article? Concerned about the content? Get in touch with us directly. Alternatively, email editorial-team (at) simplywallst.com.
This article by Simply Wall St is general in nature. We provide commentary based on historical data and analyst forecasts only using an unbiased methodology and our articles are not intended to be financial advice. It does not constitute a recommendation to buy or sell any stock, and does not take account of your objectives, or your financial situation. We aim to bring you long-term focused analysis driven by fundamental data. Note that our analysis may not factor in the latest price-sensitive company announcements or qualitative material. Simply Wall St has no position in any stocks mentioned.
About ASX:KME
Kip McGrath Education Centres
Provides tutoring services in Australasia, Europe, the United States, North America, the United Kingdom, Europe, and internationally.
Flawless balance sheet with proven track record.
Market Insights


Advertisement
Community Narratives
MicroStrategy: Volatile Gamble or Golden Opportunity?
Fair Value US$663.00|31.2% undervalued
BL
Community Contributor
Emerging Markets and Debt Reduction Will Propel Bath & Body Works Forward
Fair Value US$40.73|24.4% undervalued
ZW
Community Contributor
An amazing opportunity to potentially get a 100 bagger
Fair Value US$10.00|13.5% overvalued
DA
Community Contributor