- Australia
- /
- Consumer Durables
- /
- ASX:FWD
While shareholders of Fleetwood (ASX:FWD) are in the red over the last three years, underlying earnings have actually grown


It's nice to see the Fleetwood Limited (ASX:FWD) share price up 11% in a week. But that doesn't change the fact that the returns over the last three years have been less than pleasing. Truth be told the share price declined 37% in three years and that return, Dear Reader, falls short of what you could have got from passive investing with an index fund.
The recent uptick of 11% could be a positive sign of things to come, so let's take a look at historical fundamentals.
View our latest analysis for Fleetwood
While the efficient markets hypothesis continues to be taught by some, it has been proven that markets are over-reactive dynamic systems, and investors are not always rational. One flawed but reasonable way to assess how sentiment around a company has changed is to compare the earnings per share (EPS) with the share price.
During five years of share price growth, Fleetwood moved from a loss to profitability. That would generally be considered a positive, so we are surprised to see the share price is down. So given the share price is down it's worth checking some other metrics too.
We note that, in three years, revenue has actually grown at a 7.0% annual rate, so that doesn't seem to be a reason to sell shares. It's probably worth investigating Fleetwood further; while we may be missing something on this analysis, there might also be an opportunity.
You can see below how earnings and revenue have changed over time (discover the exact values by clicking on the image).
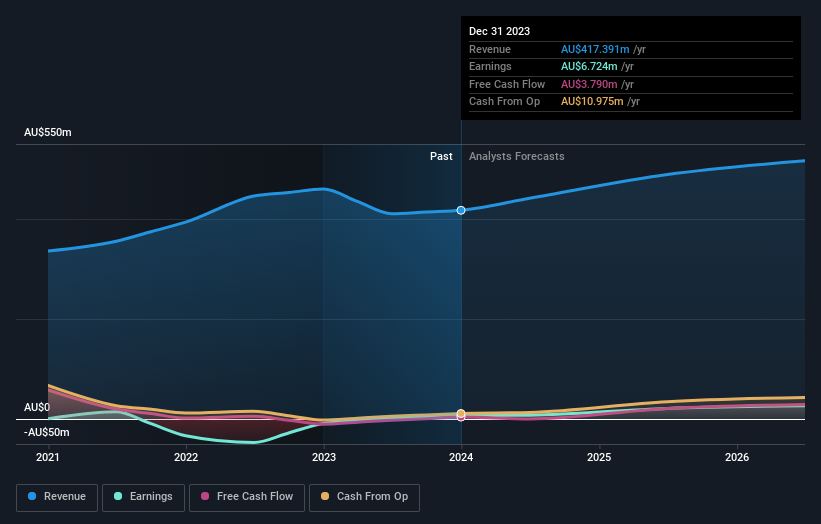
It is of course excellent to see how Fleetwood has grown profits over the years, but the future is more important for shareholders. It might be well worthwhile taking a look at our free report on how its financial position has changed over time.
What About Dividends?
When looking at investment returns, it is important to consider the difference between total shareholder return (TSR) and share price return. The TSR incorporates the value of any spin-offs or discounted capital raisings, along with any dividends, based on the assumption that the dividends are reinvested. It's fair to say that the TSR gives a more complete picture for stocks that pay a dividend. We note that for Fleetwood the TSR over the last 3 years was -32%, which is better than the share price return mentioned above. The dividends paid by the company have thusly boosted the total shareholder return.
A Different Perspective
Fleetwood provided a TSR of 8.5% over the last twelve months. But that was short of the market average. The silver lining is that the gain was actually better than the average annual return of 0.2% per year over five year. It is possible that returns will improve along with the business fundamentals. I find it very interesting to look at share price over the long term as a proxy for business performance. But to truly gain insight, we need to consider other information, too. To that end, you should be aware of the 2 warning signs we've spotted with Fleetwood .
But note: Fleetwood may not be the best stock to buy. So take a peek at this free list of interesting companies with past earnings growth (and further growth forecast).
Please note, the market returns quoted in this article reflect the market weighted average returns of stocks that currently trade on Australian exchanges.
New: AI Stock Screener & Alerts
Our new AI Stock Screener scans the market every day to uncover opportunities.
• Dividend Powerhouses (3%+ Yield)
• Undervalued Small Caps with Insider Buying
• High growth Tech and AI Companies
Or build your own from over 50 metrics.
Have feedback on this article? Concerned about the content? Get in touch with us directly. Alternatively, email editorial-team (at) simplywallst.com.
This article by Simply Wall St is general in nature. We provide commentary based on historical data and analyst forecasts only using an unbiased methodology and our articles are not intended to be financial advice. It does not constitute a recommendation to buy or sell any stock, and does not take account of your objectives, or your financial situation. We aim to bring you long-term focused analysis driven by fundamental data. Note that our analysis may not factor in the latest price-sensitive company announcements or qualitative material. Simply Wall St has no position in any stocks mentioned.
About ASX:FWD
Fleetwood
Engages in the design, manufacture, sale, and installation of modular accommodation and buildings in Australia and New Zealand.
Flawless balance sheet and good value.
