
Advertisement
- Australia
- /
- Commercial Services
- /
- ASX:STG
Here's Why We're Not At All Concerned With Straker's (ASX:STG) Cash Burn Situation

Just because a business does not make any money, does not mean that the stock will go down. For example, although Amazon.com made losses for many years after listing, if you had bought and held the shares since 1999, you would have made a fortune. Nonetheless, only a fool would ignore the risk that a loss making company burns through its cash too quickly.
So, the natural question for Straker (ASX:STG) shareholders is whether they should be concerned by its rate of cash burn. For the purposes of this article, cash burn is the annual rate at which an unprofitable company spends cash to fund its growth; its negative free cash flow. The first step is to compare its cash burn with its cash reserves, to give us its 'cash runway'.
See our latest analysis for Straker
How Long Is Straker's Cash Runway?
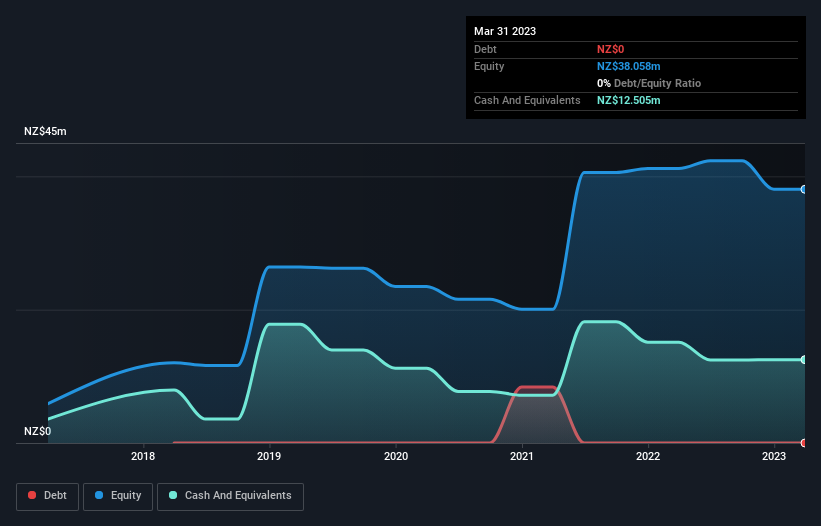
A company's cash runway is the amount of time it would take to burn through its cash reserves at its current cash burn rate. When Straker last reported its balance sheet in March 2023, it had zero debt and cash worth NZ$13m. Looking at the last year, the company burnt through NZ$884k. So it had a very long cash runway of many years from March 2023. Notably, however, the one analyst we see covering the stock thinks that Straker will break even (at a free cash flow level) before then. If that happens, then the length of its cash runway, today, would become a moot point. Depicted below, you can see how its cash holdings have changed over time.
How Well Is Straker Growing?
Straker managed to reduce its cash burn by 82% over the last twelve months, which suggests it's on the right flight path. And it could also show revenue growth of 6.3% in the same period. It seems to be growing nicely. Clearly, however, the crucial factor is whether the company will grow its business going forward. For that reason, it makes a lot of sense to take a look at our analyst forecasts for the company.
How Easily Can Straker Raise Cash?
We are certainly impressed with the progress Straker has made over the last year, but it is also worth considering how costly it would be if it wanted to raise more cash to fund faster growth. Companies can raise capital through either debt or equity. Commonly, a business will sell new shares in itself to raise cash and drive growth. By comparing a company's annual cash burn to its total market capitalisation, we can estimate roughly how many shares it would have to issue in order to run the company for another year (at the same burn rate).
Straker has a market capitalisation of NZ$38m and burnt through NZ$884k last year, which is 2.3% of the company's market value. That means it could easily issue a few shares to fund more growth, and might well be in a position to borrow cheaply.
Is Straker's Cash Burn A Worry?
It may already be apparent to you that we're relatively comfortable with the way Straker is burning through its cash. In particular, we think its cash runway stands out as evidence that the company is well on top of its spending. Its weak point is its revenue growth, but even that wasn't too bad! There's no doubt that shareholders can take a lot of heart from the fact that at least one analyst is forecasting it will reach breakeven before too long. After considering a range of factors in this article, we're pretty relaxed about its cash burn, since the company seems to be in a good position to continue to fund its growth. Taking an in-depth view of risks, we've identified 1 warning sign for Straker that you should be aware of before investing.
Of course, you might find a fantastic investment by looking elsewhere. So take a peek at this free list of interesting companies, and this list of stocks growth stocks (according to analyst forecasts)
New: Manage All Your Stock Portfolios in One Place
We've created the ultimate portfolio companion for stock investors, and it's free.
• Connect an unlimited number of Portfolios and see your total in one currency
• Be alerted to new Warning Signs or Risks via email or mobile
• Track the Fair Value of your stocks
Have feedback on this article? Concerned about the content? Get in touch with us directly. Alternatively, email editorial-team (at) simplywallst.com.
This article by Simply Wall St is general in nature. We provide commentary based on historical data and analyst forecasts only using an unbiased methodology and our articles are not intended to be financial advice. It does not constitute a recommendation to buy or sell any stock, and does not take account of your objectives, or your financial situation. We aim to bring you long-term focused analysis driven by fundamental data. Note that our analysis may not factor in the latest price-sensitive company announcements or qualitative material. Simply Wall St has no position in any stocks mentioned.
About ASX:STG
Straker
Provides language services and technology solutions in the Asia Pacific, Europe, the Middle East, Africa, and North America.
Flawless balance sheet with moderate growth potential.
Market Insights


Advertisement
Community Narratives
Alphabet: The Under-appreciated Compounder Hiding in Plain Sight
Fair Value US$282.83|31.8% undervalued
BL
Community Contributor
Planet Labs: At The Heart Of The Emerging New Space Boom
Fair Value US$11.31|44.7% undervalued
AN
Community Contributor
Exxon in Guyana 5 year forecast Low $135 to High $189
Fair Value US$189.00|40.9% undervalued
AG
Community Contributor