Advertisement
- Australia
- /
- Electrical
- /
- ASX:MYG
Mayfield Group Holdings (ASX:MYG): Exploring Valuation After $30 Million Equity Raise

Simply Wall St
Reviewed by Simply Wall St
Mayfield Group Holdings (ASX:MYG) just wrapped up a series of follow-on equity offerings, raising over A$30 million. This fresh capital injection has investors weighing the potential impact on the company’s outlook and future initiatives.
See our latest analysis for Mayfield Group Holdings.
The recent equity raise comes against the backdrop of remarkable momentum for Mayfield Group Holdings. While the past day’s share price return was flat, the stock soared 15% over the past week and delivered a massive 29% share price return in the last month. Year to date, the share price has gained an impressive 186%, and if you held on for three years, your total shareholder return would be over 741%. This surge suggests investors see real potential in Mayfield’s growth story, with the capital raise adding to the buzz around future expansion.
If Mayfield’s rally has you curious about what else is gaining traction, now is a great time to broaden your search and discover fast growing stocks with high insider ownership
But with shares now trading above analyst price targets, and the recent capital boost fueling even higher expectations, the real question is whether Mayfield remains undervalued or if future growth is already reflected in the price.
Price-to-Earnings of 33x: Is it justified?
Mayfield Group Holdings trades at a price-to-earnings (P/E) ratio of 33x, well above both its peer average and the wider industry. At a last close price of A$2.29, this signals the market is pricing in a premium for its future potential.
The price-to-earnings ratio tells investors how much they are paying for each dollar of current earnings. For a company like Mayfield, a high P/E can indicate that investors expect future growth in earnings that justifies today's higher price tag.
Despite Mayfield’s strong recent earnings growth, the current 33x P/E is expensive not only by historical benchmarks but also compared to the Global Electrical industry average of 30.7x and its peer average of 25.9x. The estimated fair P/E ratio is 24x, which is considerably lower than the current level and a potential reference point for where valuations could settle if growth expectations moderate.
Explore the SWS fair ratio for Mayfield Group Holdings
Result: Price-to-Earnings of 33x (OVERVALUED)
However, slower earnings growth or a shift in market sentiment could quickly challenge the optimism that is currently priced into Mayfield shares.
Find out about the key risks to this Mayfield Group Holdings narrative.
Another View: Discounted Cash Flow Tells a Different Story
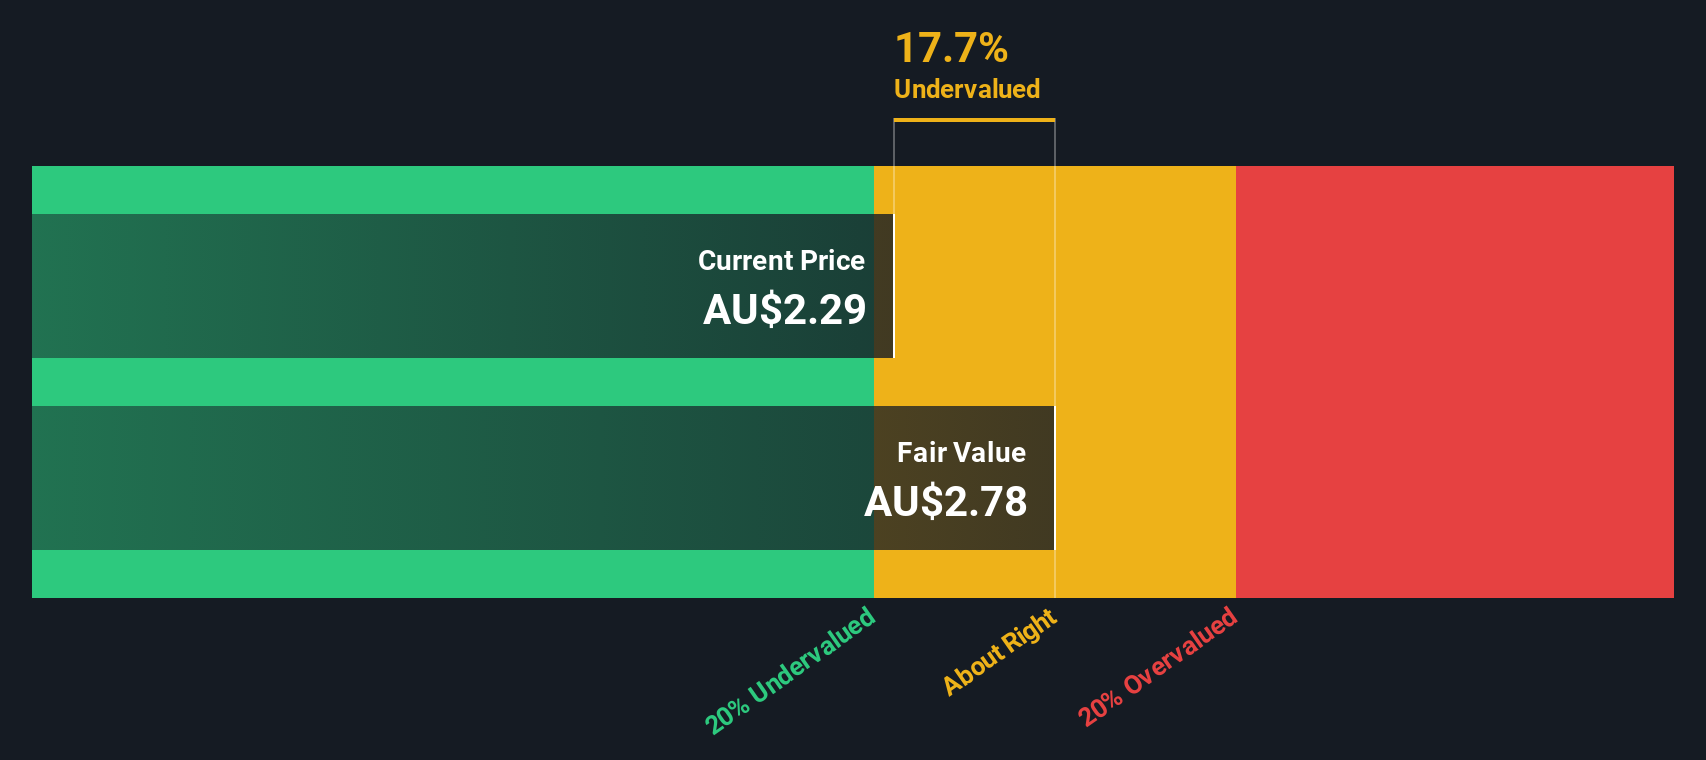
Looking at Mayfield through the lens of our SWS DCF model, the outlook is much less stretched. The DCF suggests that shares are actually undervalued by more than 17%, with a fair value estimate of A$2.78 compared to the current price. Could this offer a cushion for buyers, or is the market seeing things the model does not?
Look into how the SWS DCF model arrives at its fair value.
Simply Wall St performs a discounted cash flow (DCF) on every stock in the world every day (check out Mayfield Group Holdings for example). We show the entire calculation in full. You can track the result in your watchlist or portfolio and be alerted when this changes, or use our stock screener to discover 870 undervalued stocks based on their cash flows. If you save a screener we even alert you when new companies match - so you never miss a potential opportunity.
Build Your Own Mayfield Group Holdings Narrative
If you want to dig deeper or draw your own conclusions, it only takes a few minutes to build your own view of Mayfield Group Holdings. Do it your way
A great starting point for your Mayfield Group Holdings research is our analysis highlighting 3 key rewards and 1 important warning sign that could impact your investment decision.
Looking for more investment ideas?
Put yourself in the winning seat by checking out unique opportunities with potential for strong returns. Let Simply Wall Street's powerful tools help guide your next move.
- Capitalize on early-stage growth stories with these 3585 penny stocks with strong financials, which offer standout financials and real momentum.
- Tap into the future of medicine by reviewing these 31 healthcare AI stocks, which is transforming patient care and advancing medical innovation.
- Supercharge your returns by evaluating these 870 undervalued stocks based on cash flows, supported by robust cash flow fundamentals and attractive entry points.
This article by Simply Wall St is general in nature. We provide commentary based on historical data and analyst forecasts only using an unbiased methodology and our articles are not intended to be financial advice. It does not constitute a recommendation to buy or sell any stock, and does not take account of your objectives, or your financial situation. We aim to bring you long-term focused analysis driven by fundamental data. Note that our analysis may not factor in the latest price-sensitive company announcements or qualitative material. Simply Wall St has no position in any stocks mentioned.
New: Manage All Your Stock Portfolios in One Place
We've created the ultimate portfolio companion for stock investors, and it's free.
• Connect an unlimited number of Portfolios and see your total in one currency
• Be alerted to new Warning Signs or Risks via email or mobile
• Track the Fair Value of your stocks
Have feedback on this article? Concerned about the content? Get in touch with us directly. Alternatively, email editorial-team@simplywallst.com
About ASX:MYG
Mayfield Group Holdings
Provides electrical and telecommunications infrastructure products and services in Australia.
Flawless balance sheet with reasonable growth potential.
Market Insights

Advertisement
Community Narratives
MINISO's fair value is projected at 26.69 with an anticipated PE ratio shift of 20x
Fair Value US$24.03|11.4% undervalued
BE
Community Contributor
Procter & Gamble: A Dividend Giant Facing Slowing Growth
Fair Value US$119.81|23.5% overvalued
AN
Community Contributor
Eli Lilly's Future Growth Driven by Tirzepatide and Favorable Market Conditions
Fair Value US$1.19k|14.0% undervalued
EA
Community Contributor